|
||
|
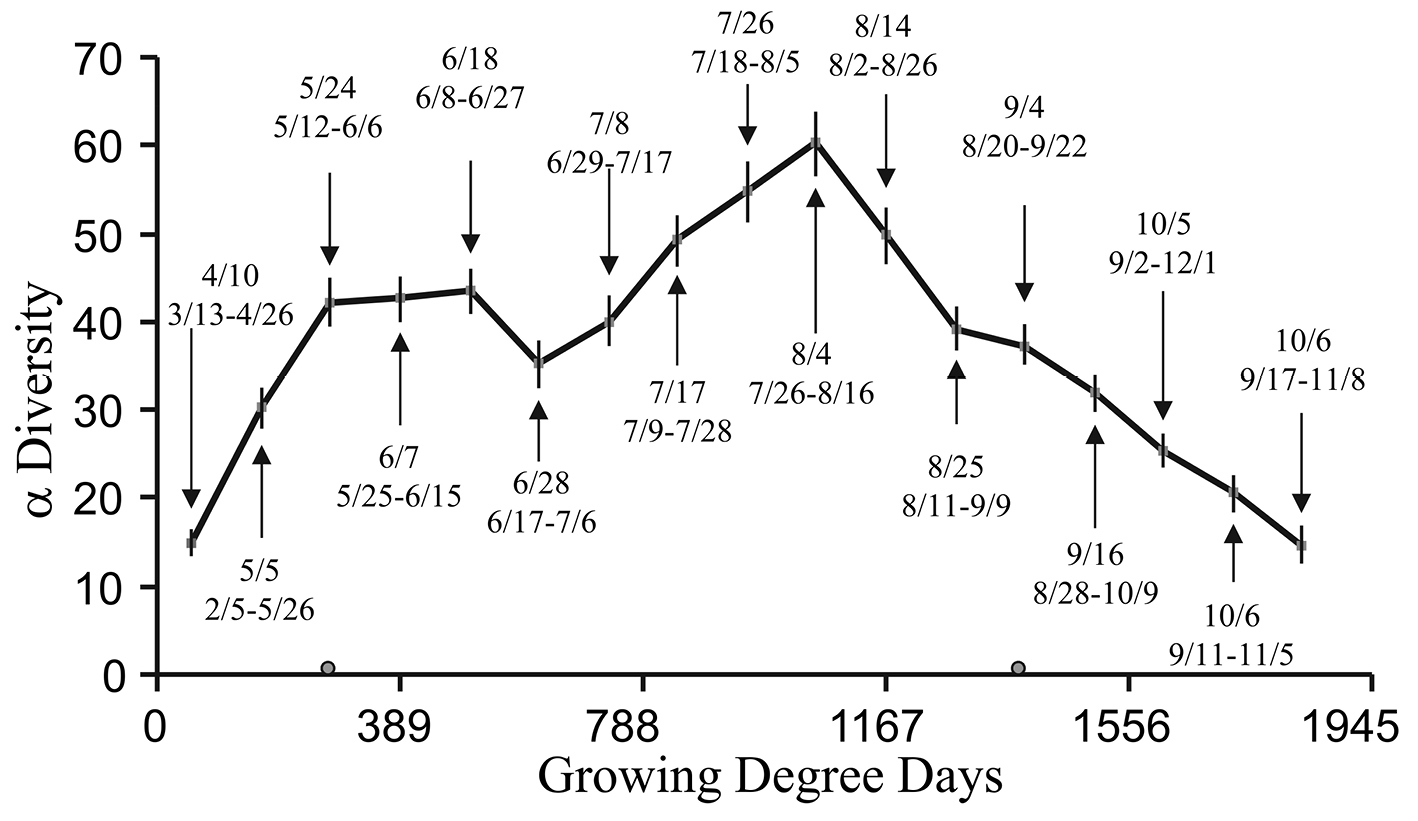
Seasonal and yearly change in a diversity. Bars show the 95% confidence interval. The top date for season was the average date for the midpoint, while the bottom dates give the range in month/day format. |
|
||||||||
| Part of: Downer R, Ebert T (2014) Macrolepidoptera biodiversity in Wooster, Ohio from 2001 through 2009. ZooKeys 452: 79-105. https://doi.org/10.3897/zookeys.452.8009 |