|
||
|
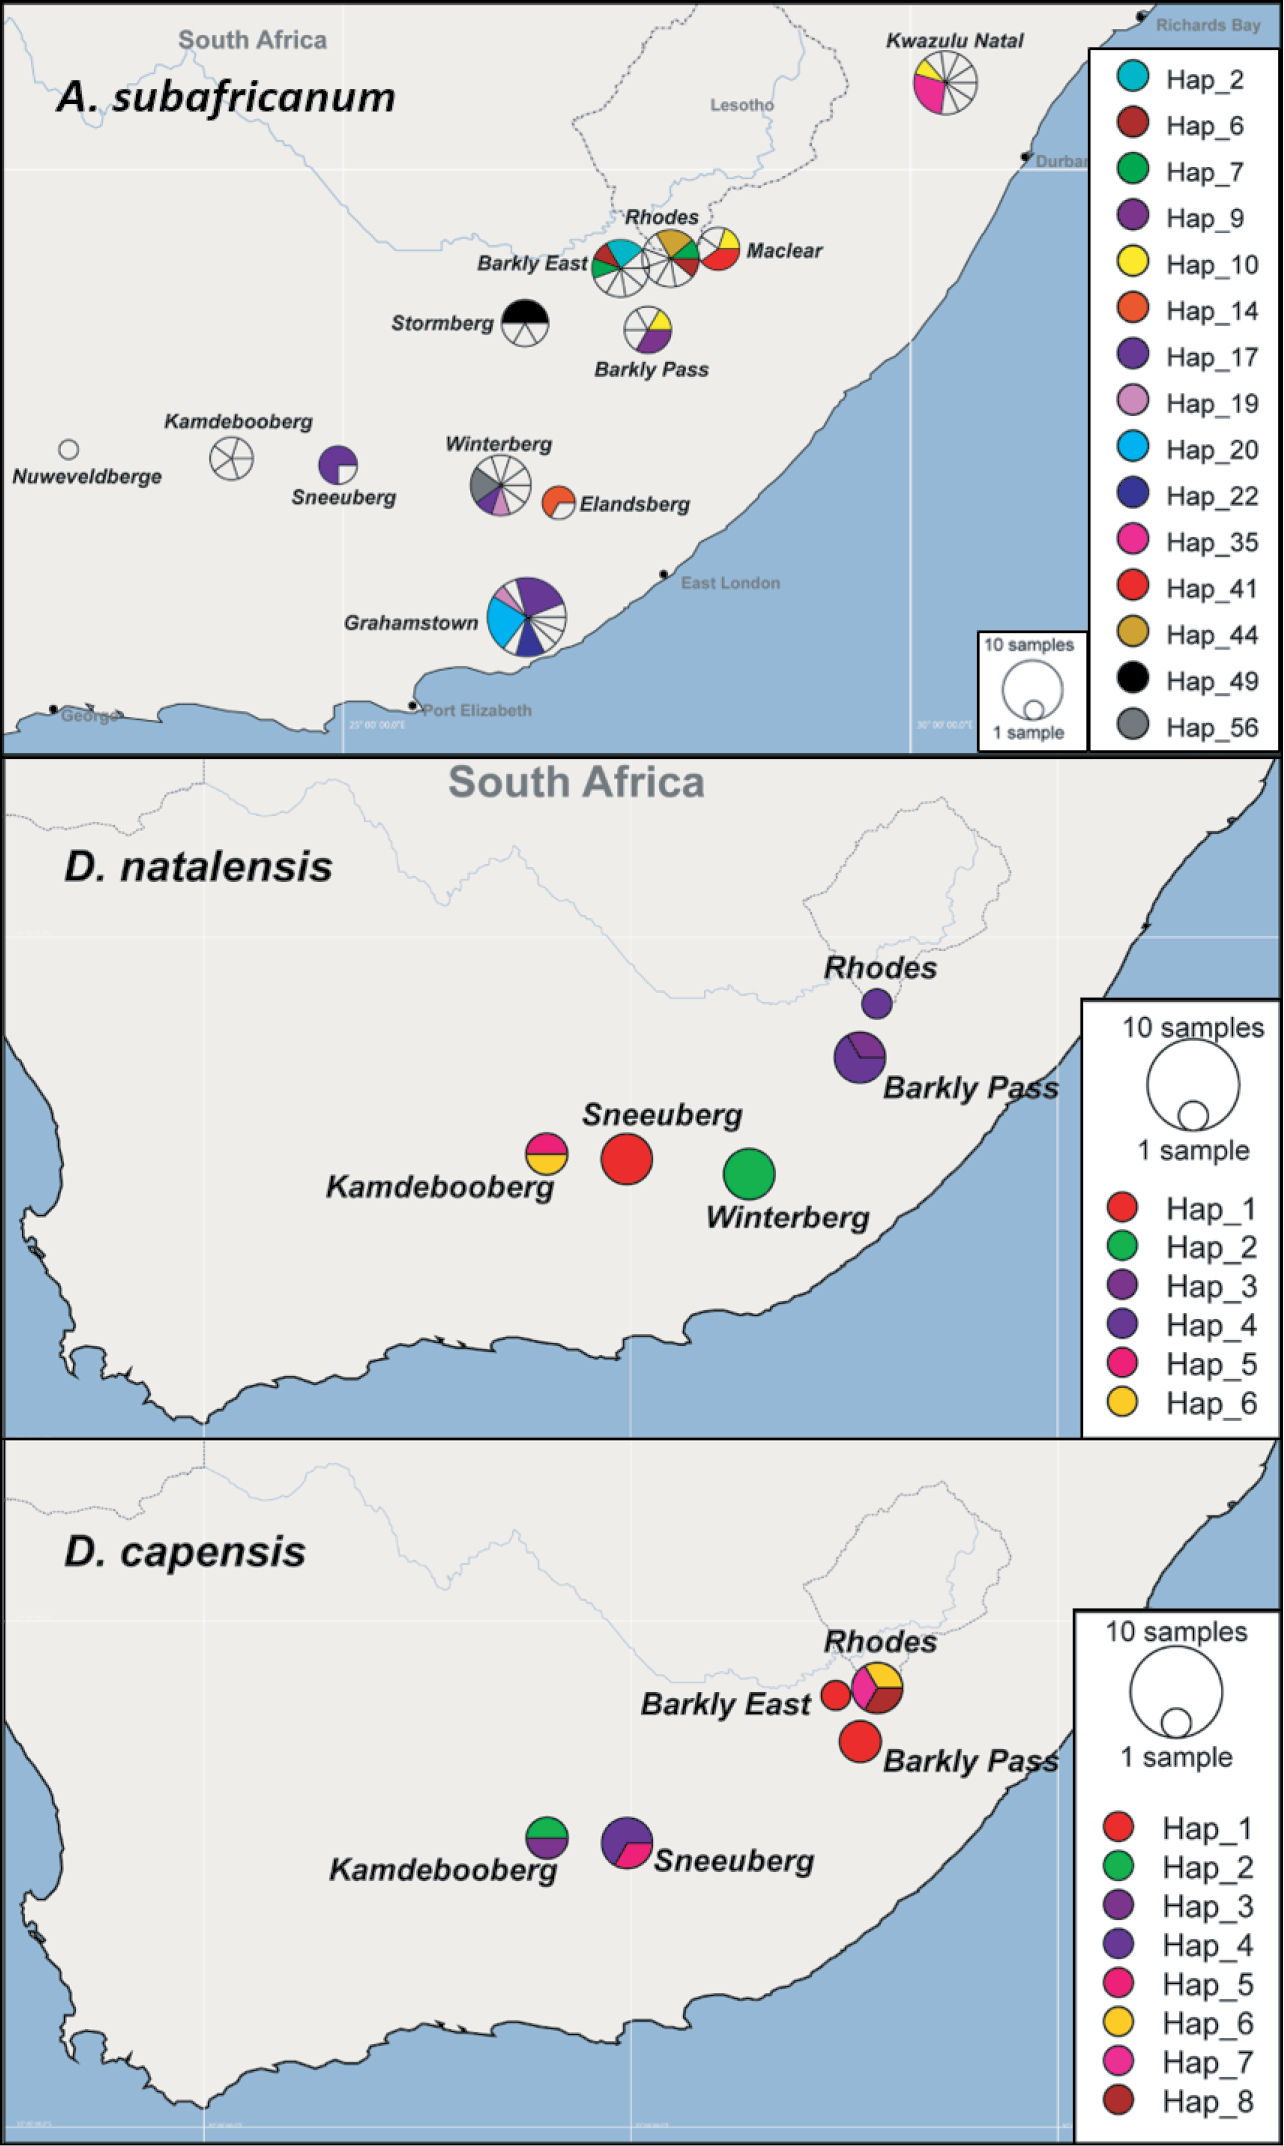
Distribution of A. sudafricanum, D. natalensis and D. capensis COI haplotypes across the study area. The map shows the study areas defined in Table 1, and the pie charts indicate the haplotype composition of the population from each area. Each colour represents a shared haplotype found across the study area; private haplotypes (singletons found in the samples from one particular population and are absent in the samples from other populations) are represented as clear sections within the pie charts. |