|
||
|
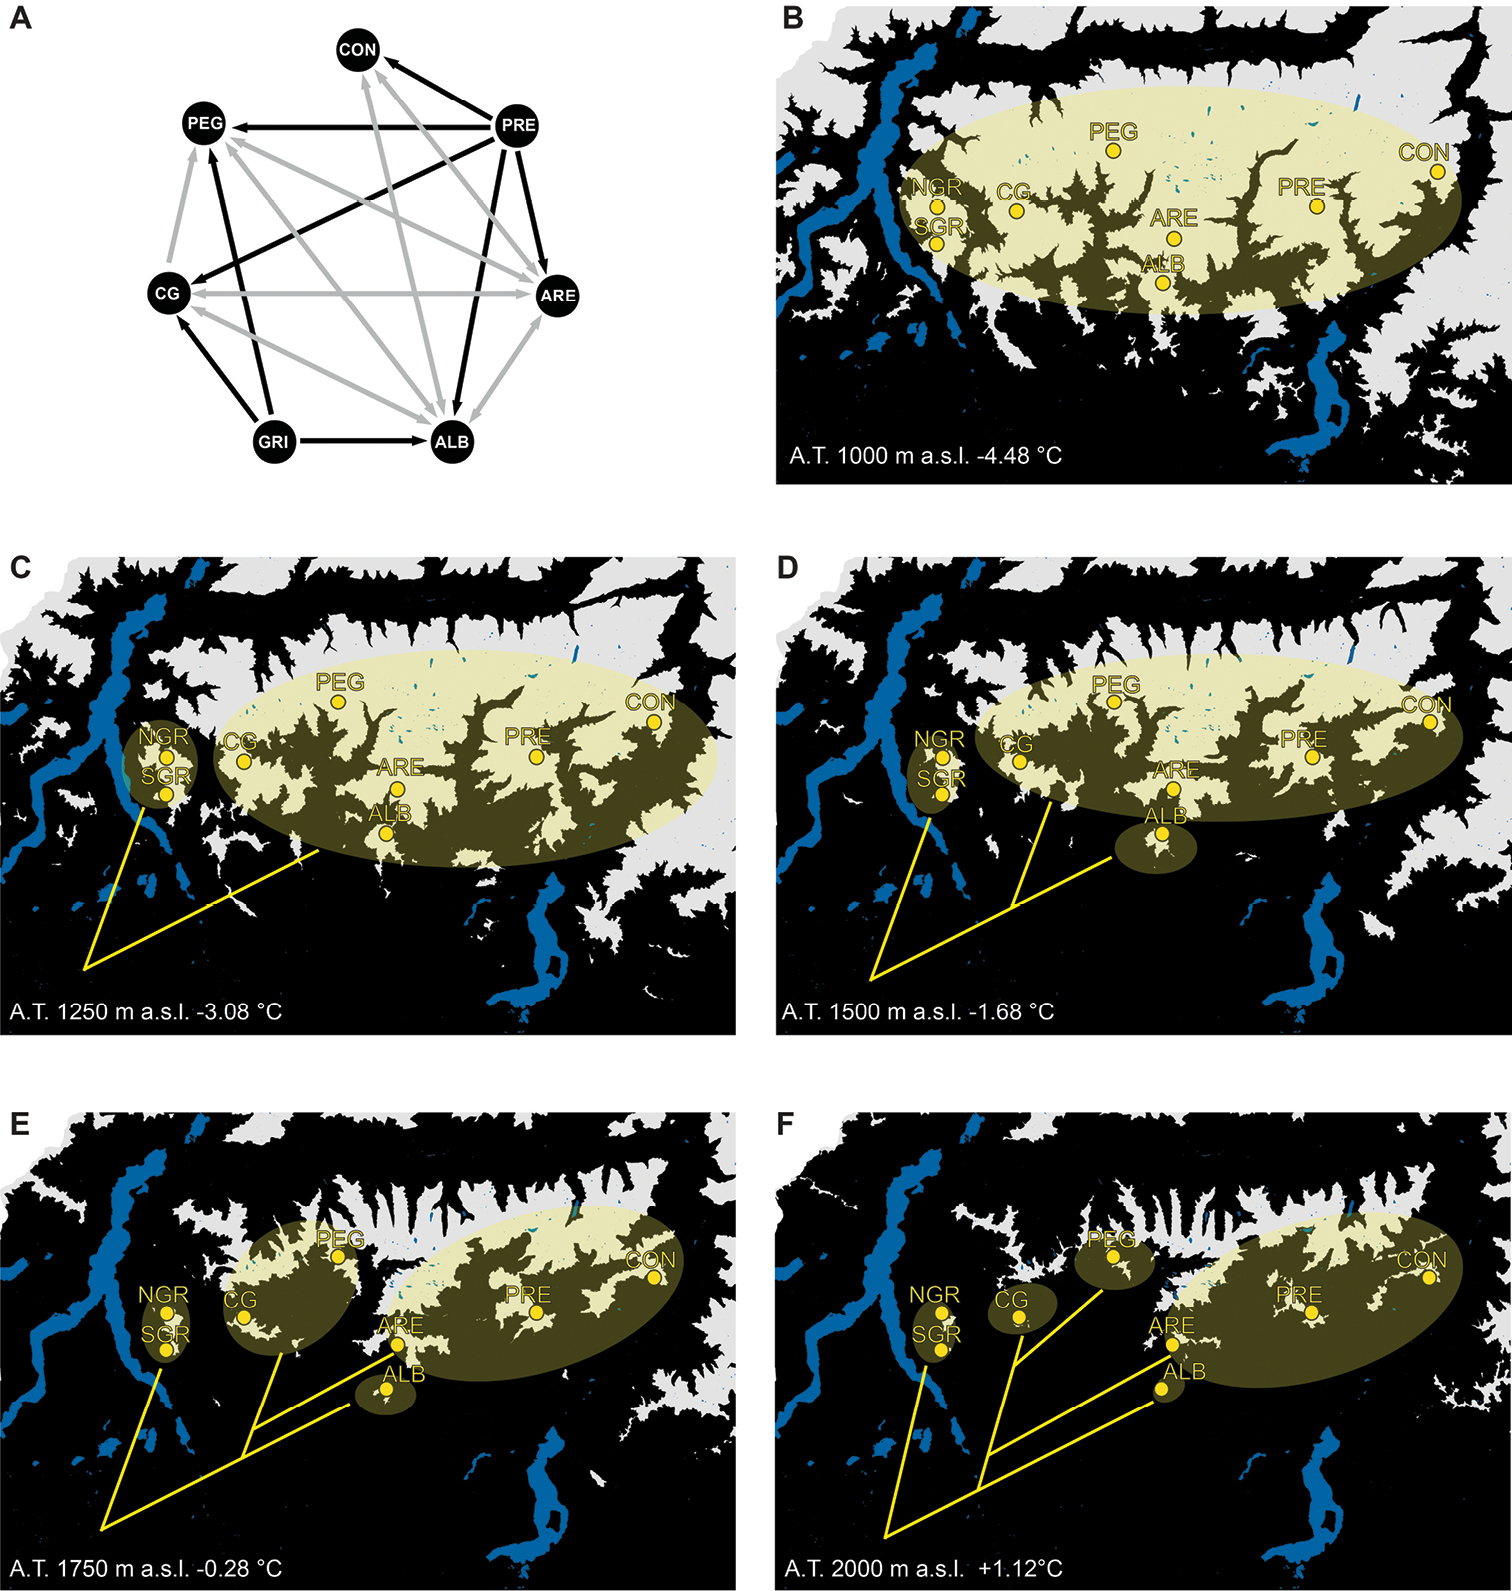
Most likely migration model and altitudinal habitat maps reporting suitable area for the presence of the species during cold periods. A Most likely migration model. Arrows indicate unidirectional flows (in black) and bidirectional flows (in gray) between populations. B–F Suitable altitudinal habitat maps. In light grey are reported the areas suitable for the presence of the species above a certain altitudinal threshold; the yellow ellipses are schematic drawing of Cryptocephalus barii populations; dendrograms showing the divergence events among populations, according to the tree in Fig. 1, are superimposed on the maps. At the bottom left of each map are reported: the minimum elevation at which climatic conditions are suitable for the presence of Cryptocephalus barii (inferred from present knowledge) corresponding to the altitudinal threshold used to draw the suitable areas, and the corresponding estimates of temperature variation in respect to the present. Abbreviations: A.T. = altitudinal threshold; CON = Concarena; PRE = Presolana; ARE = Arera; ALB = Alben; GRI = Grigna; NGR = northern Grigna; SGR = southern Grigna; CG = Corna Grande; PEG = Pegherolo. |