|
||
|
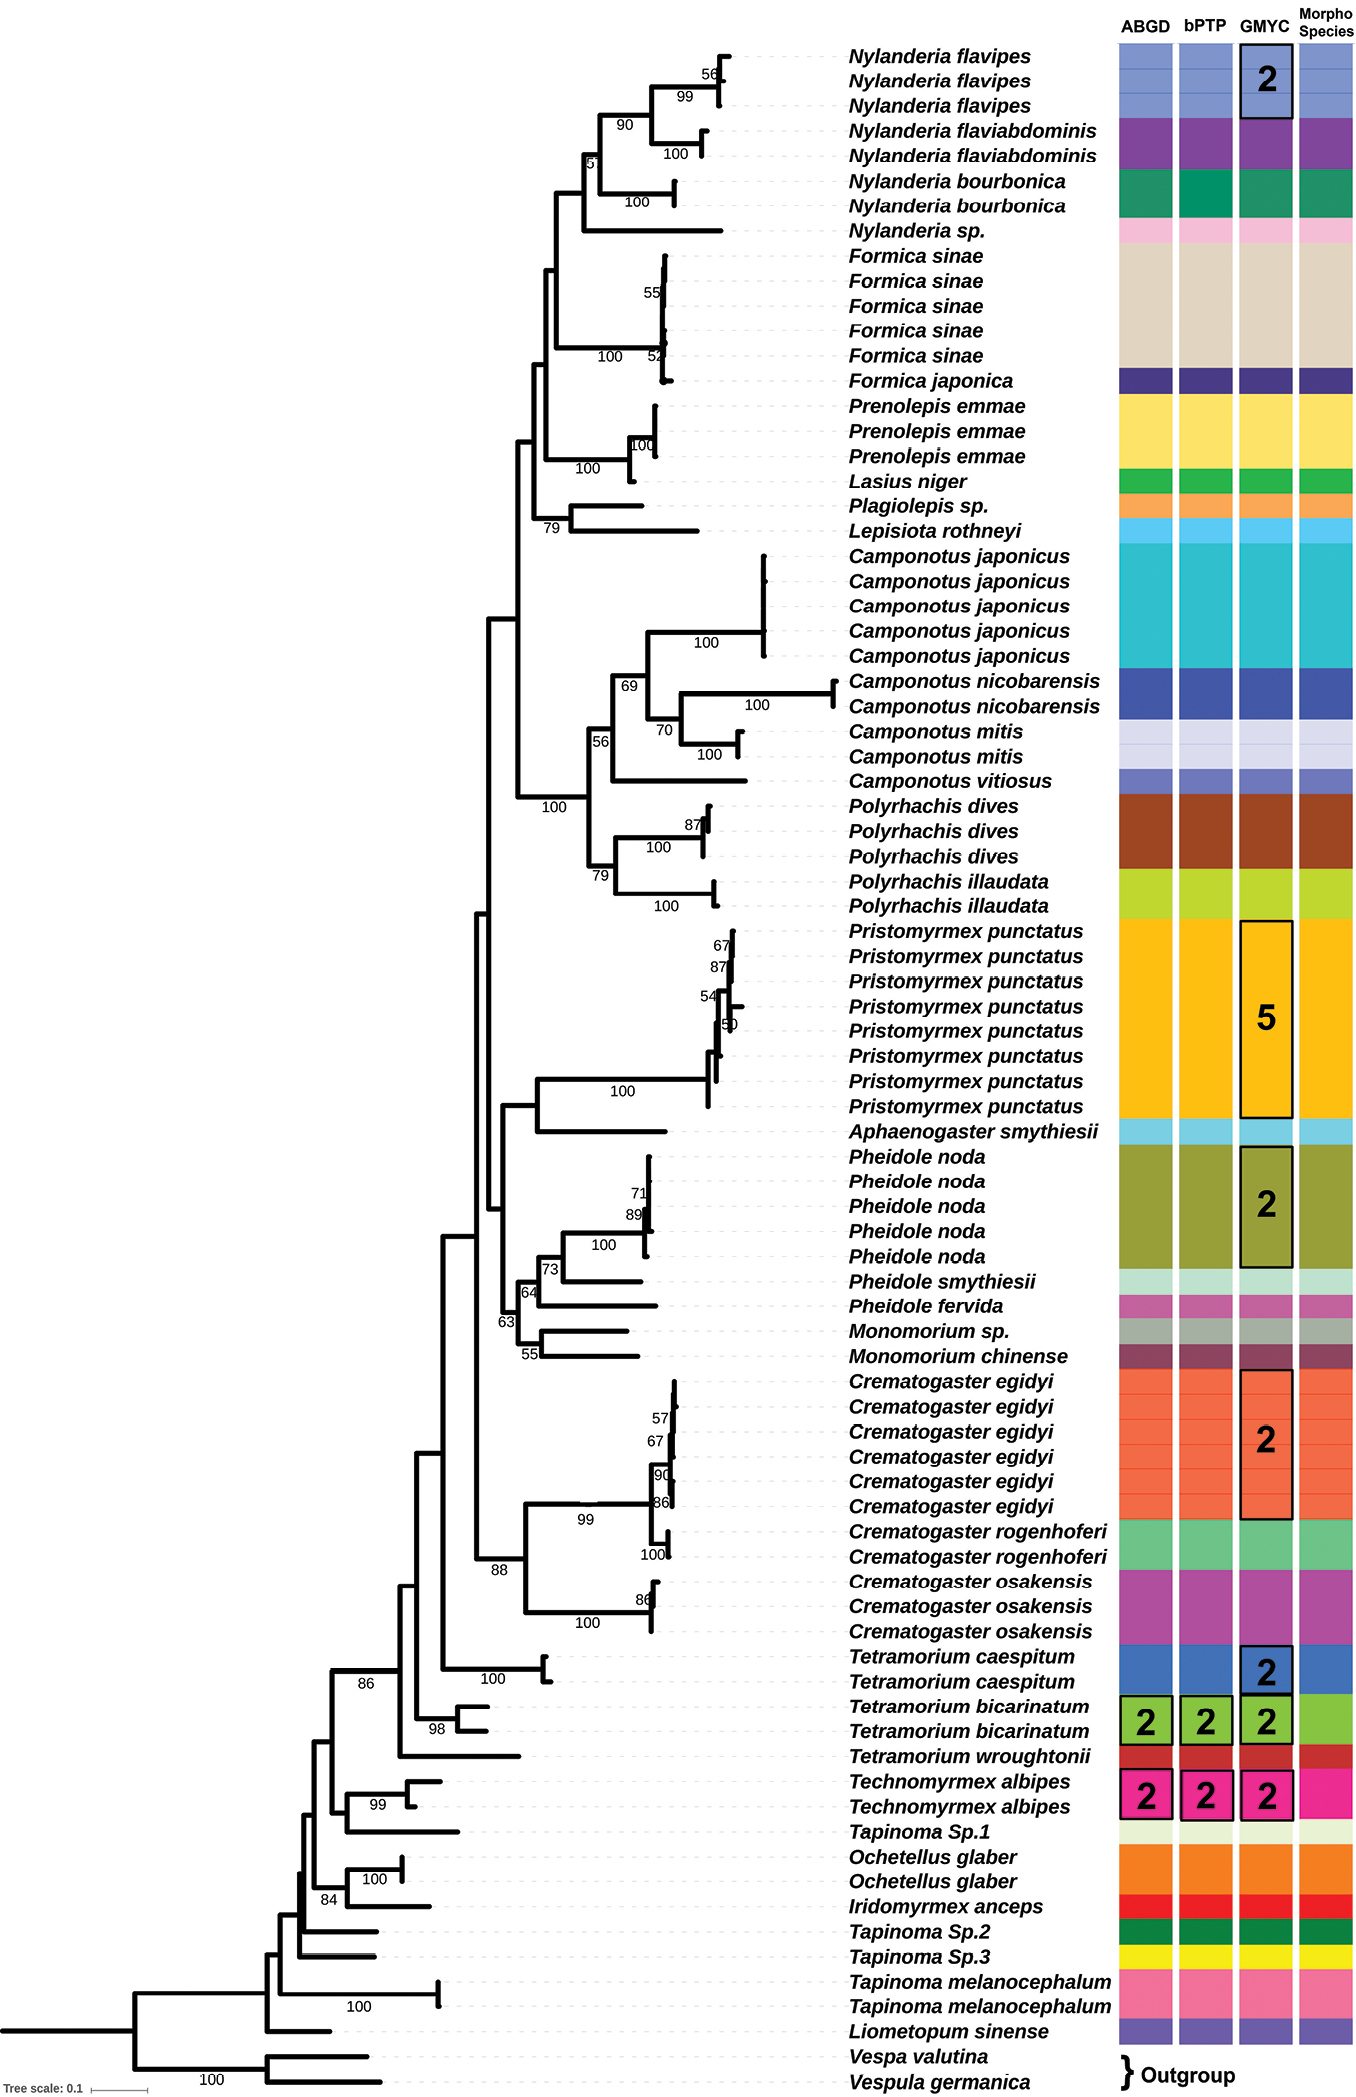
Maximum likelihood haplotype tree for the COI gene. Bootstrap values higher than 50 are displayed. Color strips on the right side represent the MOTUs produced by ABGD, bPTP and GMYC methods; extreme right one indicates the morphologically identified species. Black square around some bars indicates differences between the MOTUs and morphospecies. Values inside the square indicate the number of MOTUs produced by different approaches. |