|
||
|
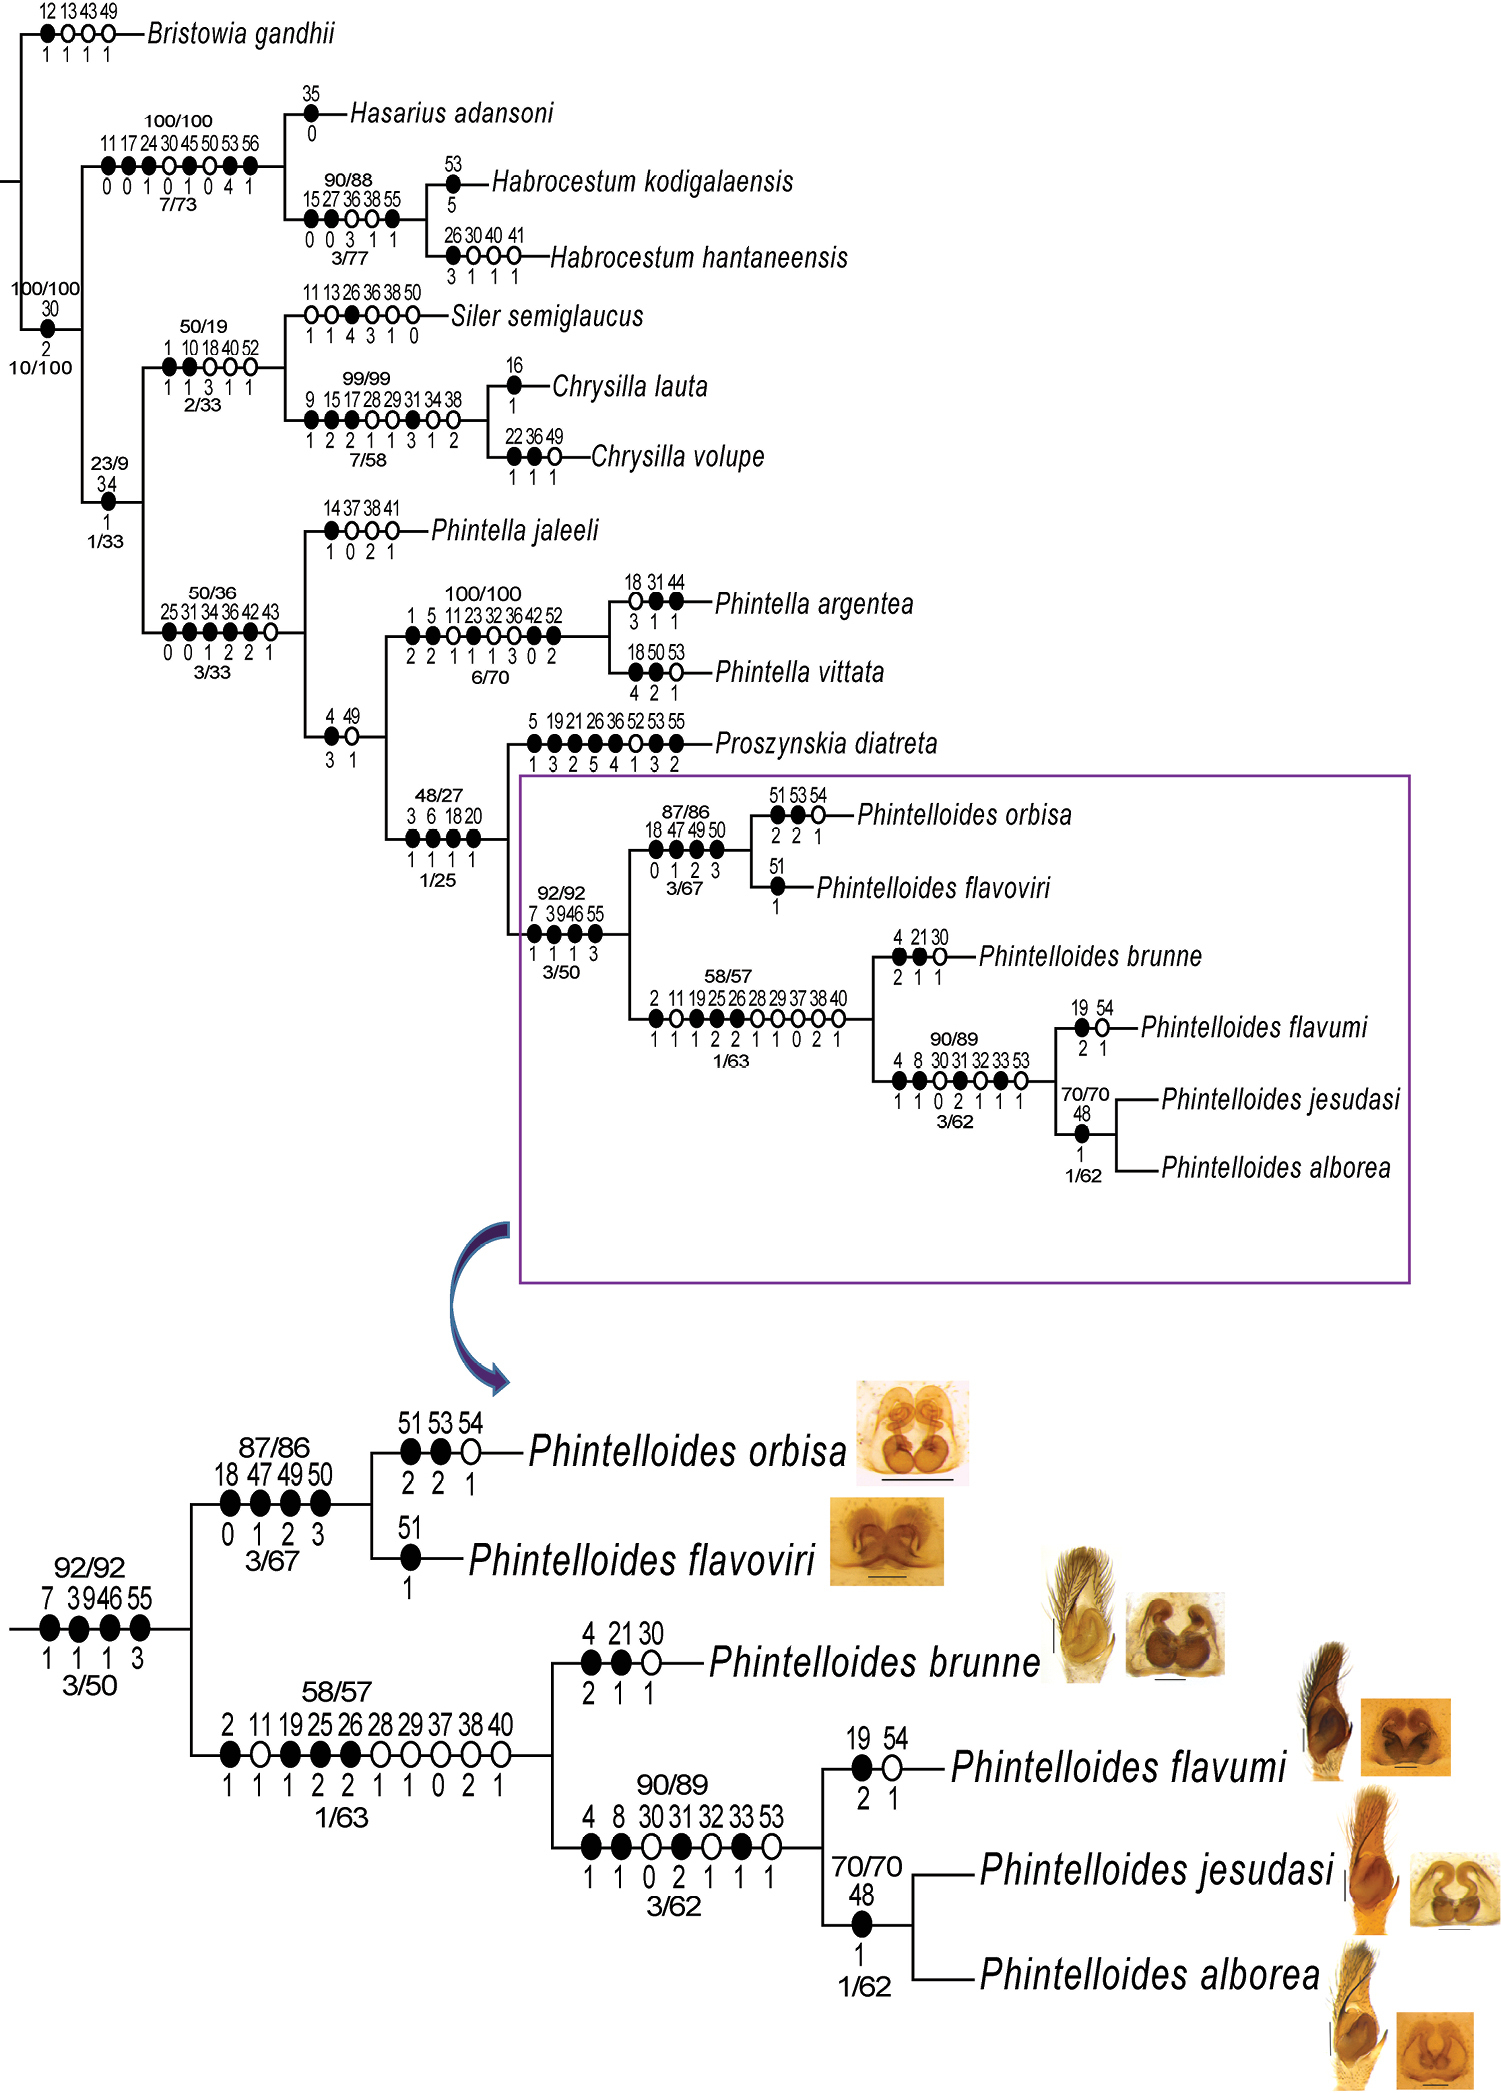
The single MP tree obtained by parsimony analysis in TNT under implied weights of the 56 morphological characters given in Table 2. Unambiguous character state changes are mapped using Farris optimisation. Characters are denoted by the numbers above the circles and character state changes by numbers below the circles. The values above the lines represent sympatric resampling frequencies/sympatric resampling frequency differences, while the values below the line represent Bremer support/relative Bremer support. |