|
||
|
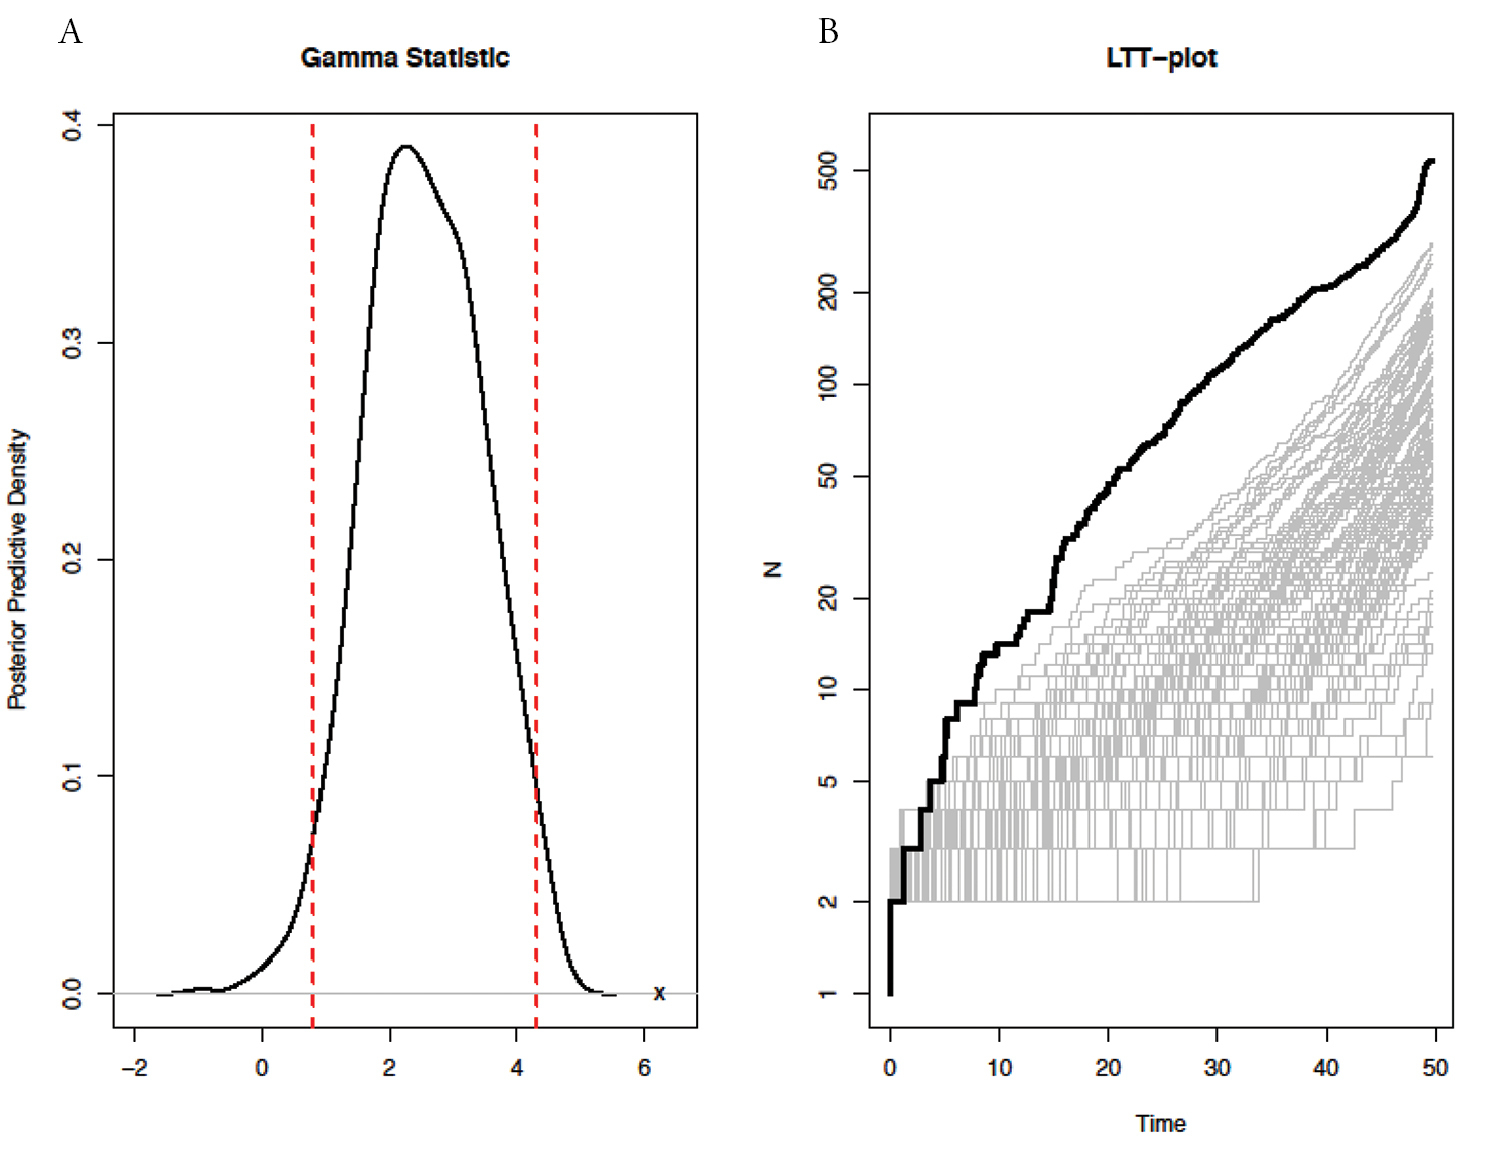
Comparative analysis of the fit of observed diversification pattern of African Cyprinidae to the constant-rate birth-death model using posterior-predictive simulation. Left panel (A): The posterior-predictive distribution for the gamma statistic; the dashed red lines indicate the 95% credible interval, and the “x” indicates the location of the value of the observed gamma statistic. Right panel (B): Lineage-through-time plot for the simulated phylogenies (grey) and for the phylogeny African Cyprinidae (bold black). |