|
||
|
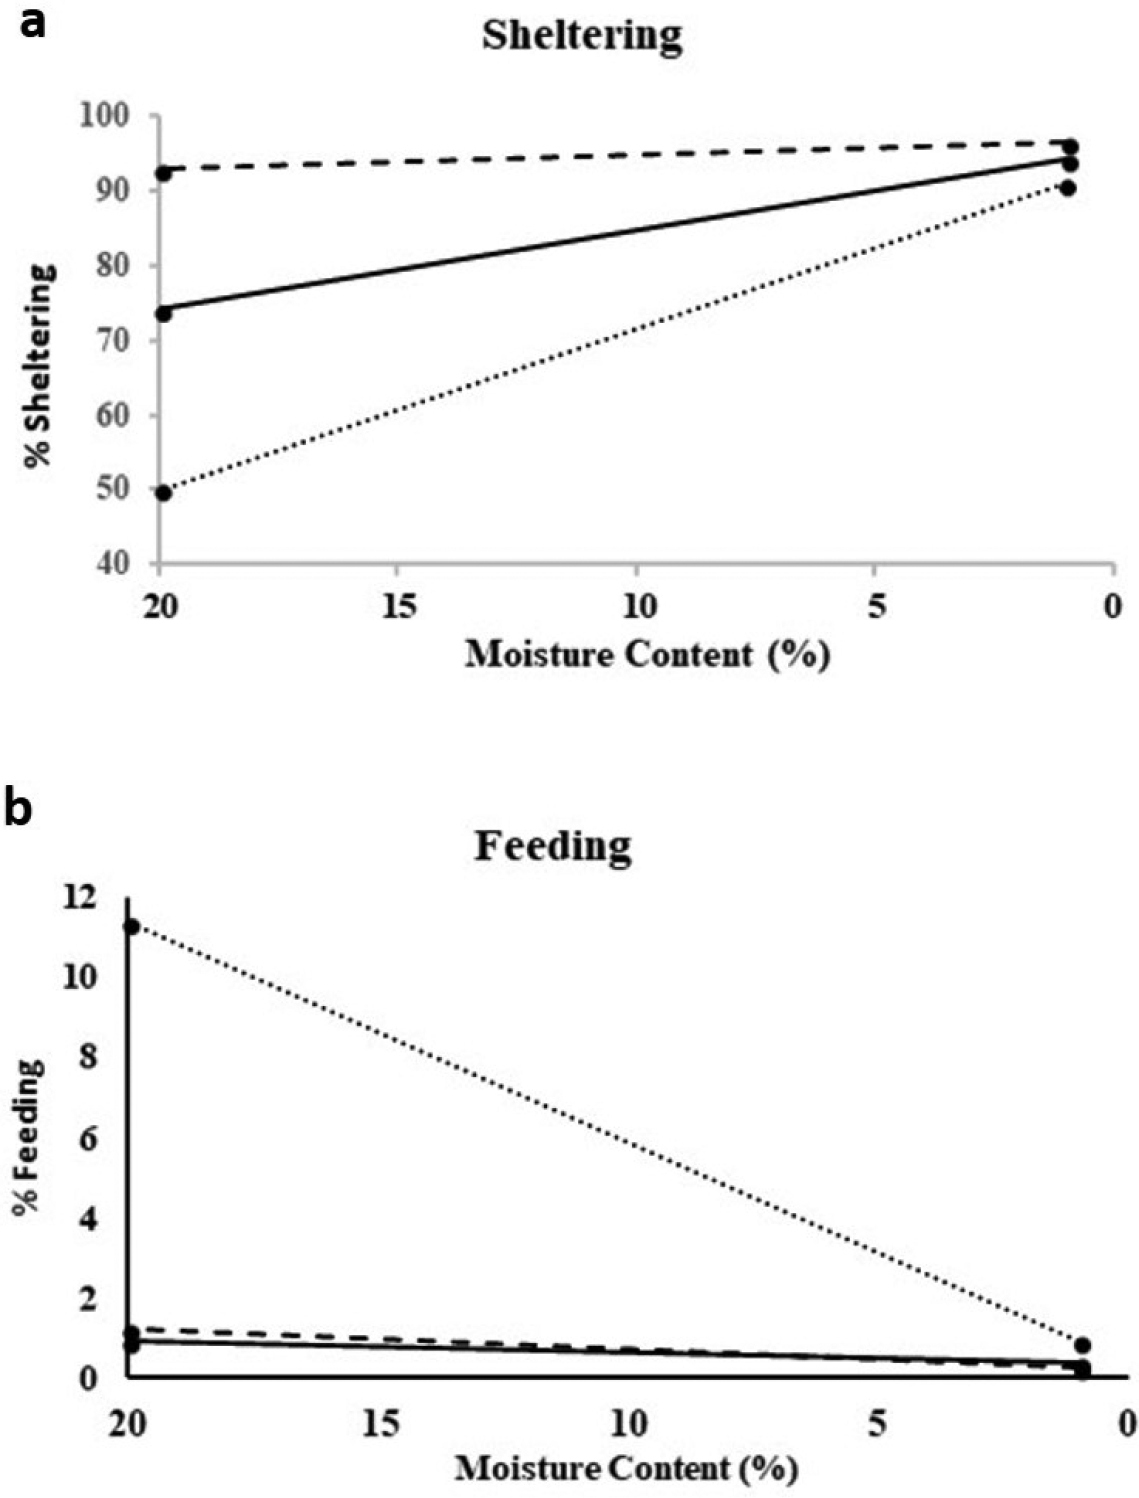
Moisture reaction norms for a) sheltering and b) feeding behaviours with changing sand moisture content (time spent in behaviour as percentages of total observed behaviours). Lines represent linear regression models: A. vulgare (solid line) (sheltering: y = 95.24 – 1.05×; feeding: y = 0.32 + 0.03), P. scaber (dashed line) (sheltering: y = 96.72 – 0.19×; feeding: y= 0.22 + 0.05×), Ph. muscorum (dotted line) (sheltering: y = 93.14 – 2.16×; feeding: y = 0.36 + 0.55x). Further regression statistics and number of observations (N), are given in Table 1. |