|
||
|
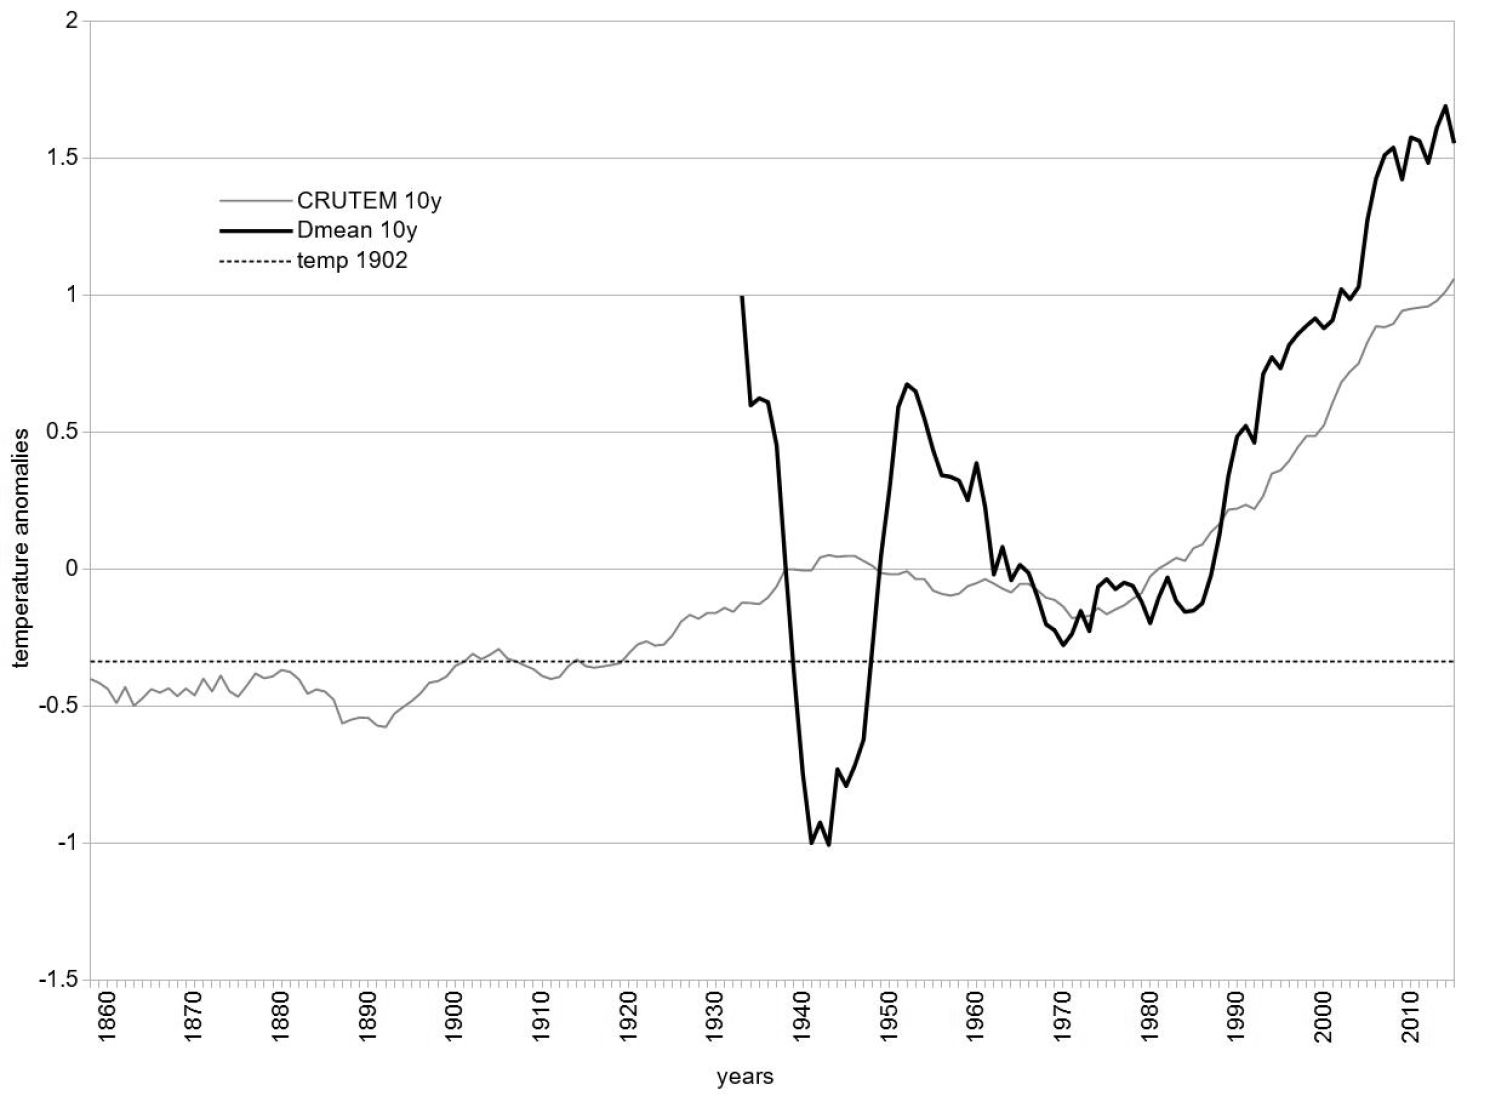
Trends of global and local ten years running average temperature anomalies. The local (Rolle Pass) temperature trend (bold black line, based on the Meteotrentino database, see Data Accessibility) consistently with the global temperature trend (based on CRUTEM4 database) is expressed as temperature anomalies from the base period 1961–90 (see Jones et al. 2012). The horizontal dotted line shows the average global temperature anomaly in 1902, after this year the global trend cross the line downwards only one time. During the last 30 years, global and local trends are consistent with the climate change hypothesis. |