|
||
|
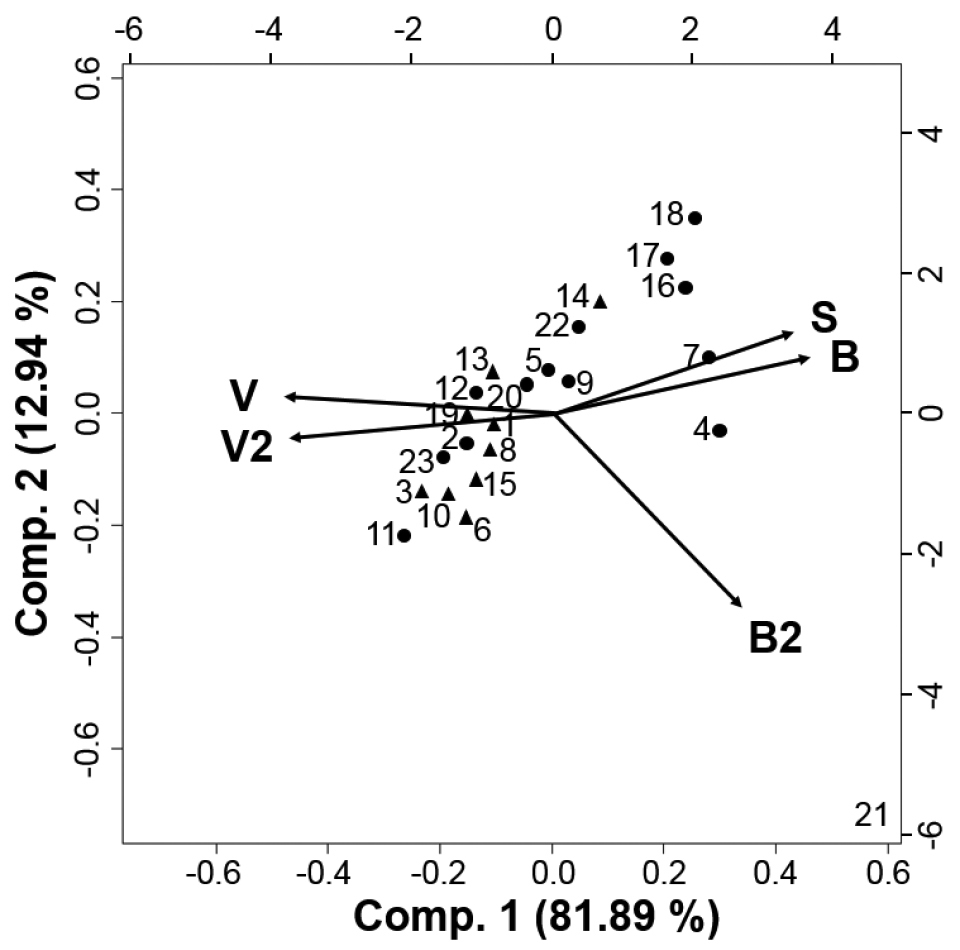
PCA biplot of the sample sites according to the urbanisation variables. Abbreviations: B - mean building density, B2 - number of cells with high building density, S: number of cells with road, V: mean vegetation density, V2: number of cells with high vegetation density. Numbers are sample site (same as in Fig. 1). Symbols indicate rural (▲) and disturbed (●) habitats. |