|
||
|
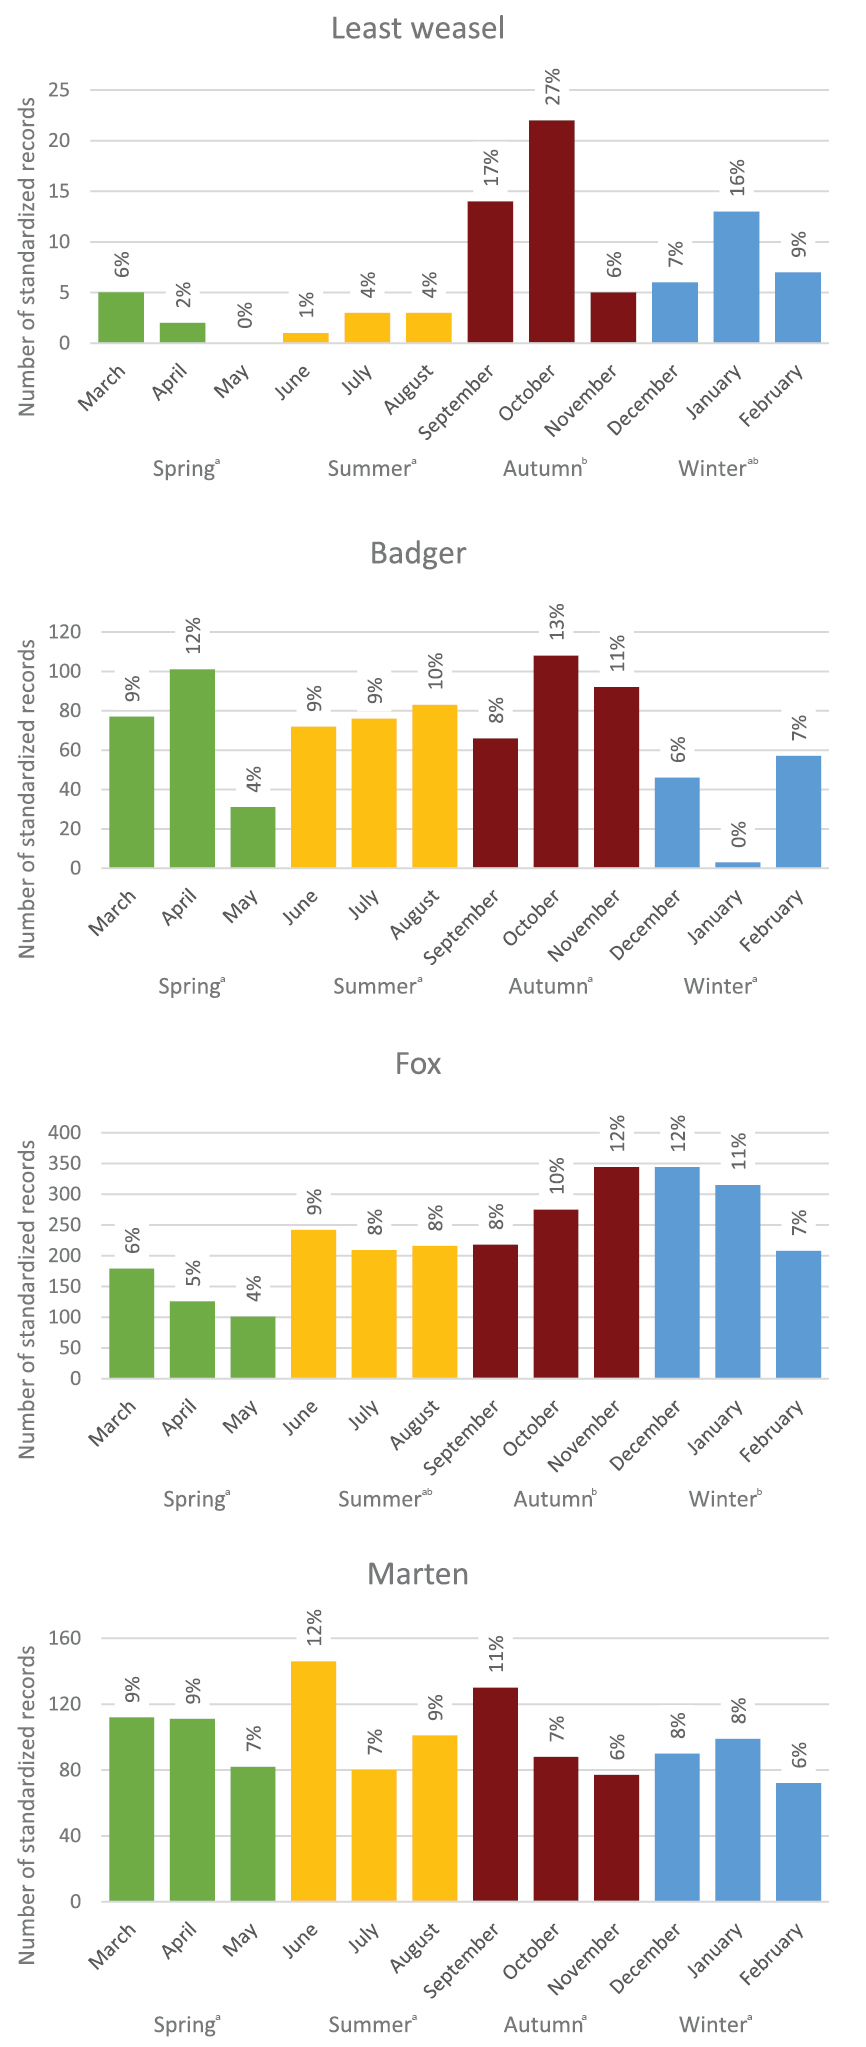
Seasonal dynamics shown for the carnivore species commonly occurring in the study area (with > 50 standardized daily records). The data were collected from June 2015 to May 2016, and the seasons are arranged in annual sequence for better illustration of seasonal dynamics. Seasons bearing the same letter are not significantly different from each other, based on linear model testing differences in the total number of records over the three months within the season. Values on top of the bars are percentages of the total number of records for a given species. |