|
||
|
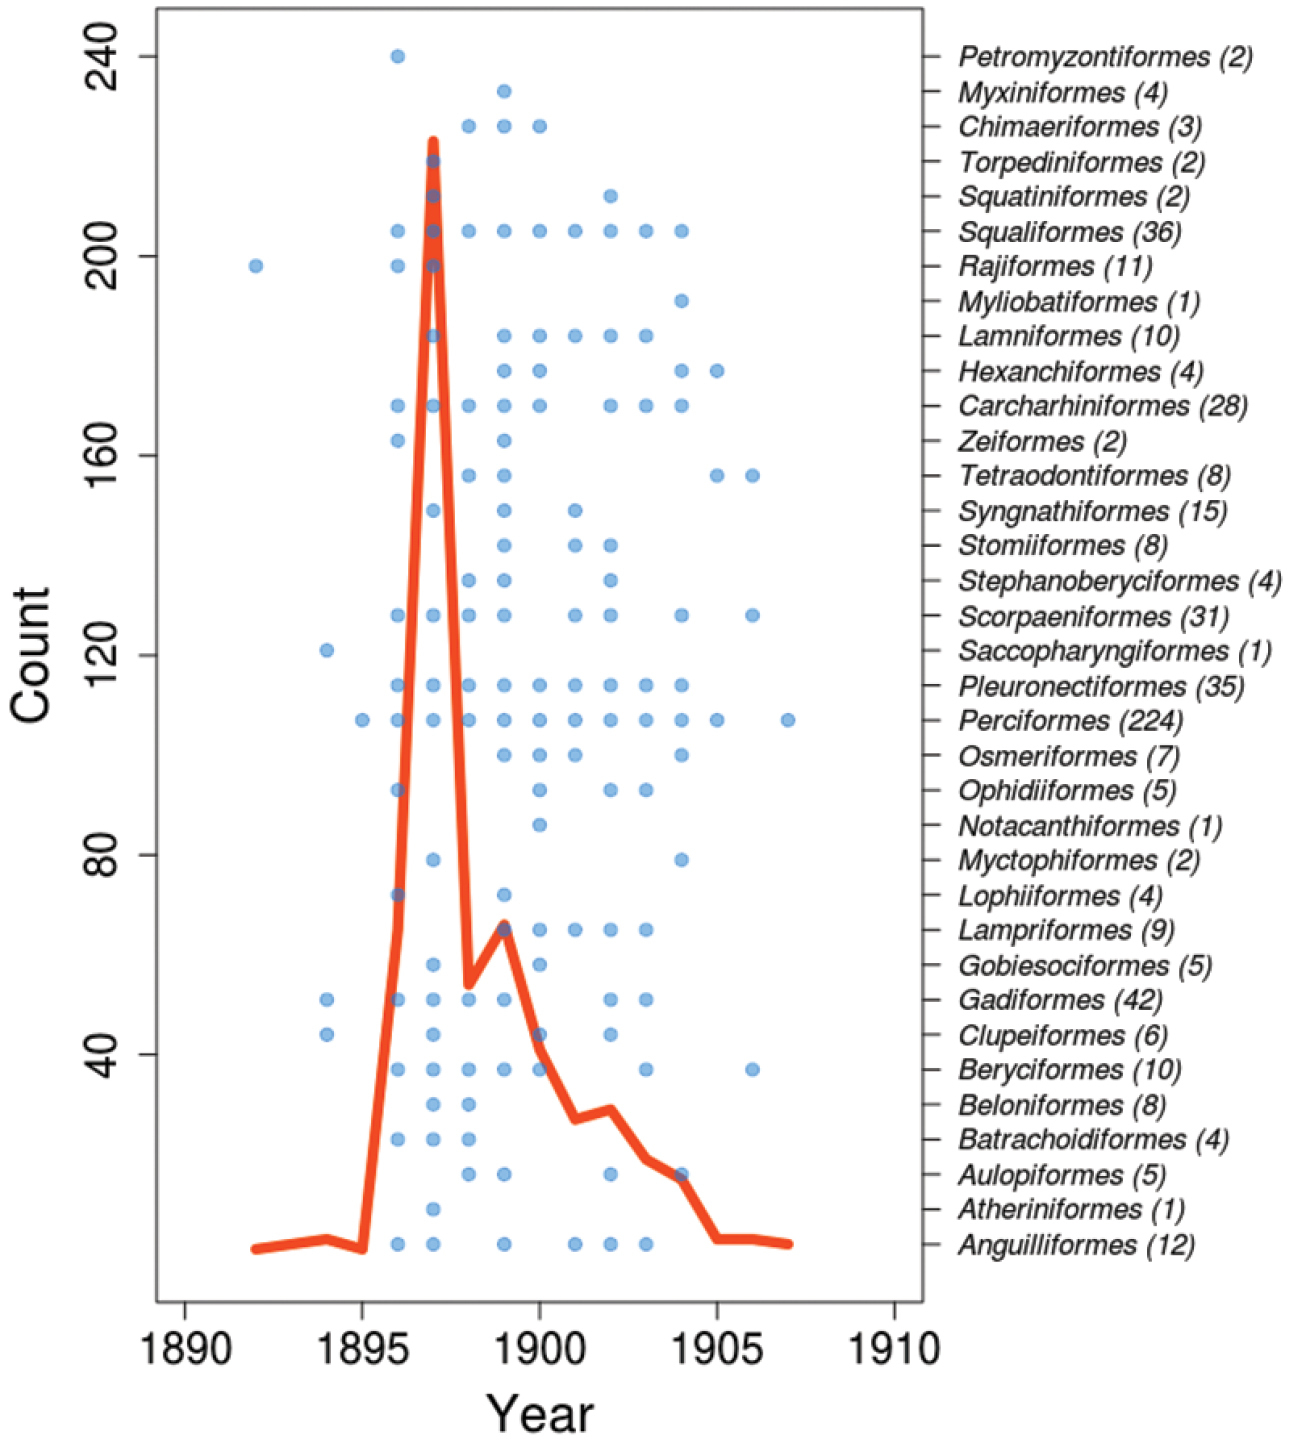
Temporal profile of the sampling years of the specimens held in the ichthyological collection. Blue dots represent sampling years for each order, for which, in parentheses, the number of specimens is provided. The red curve shows the number of specimens collected per year. |