|
||
|
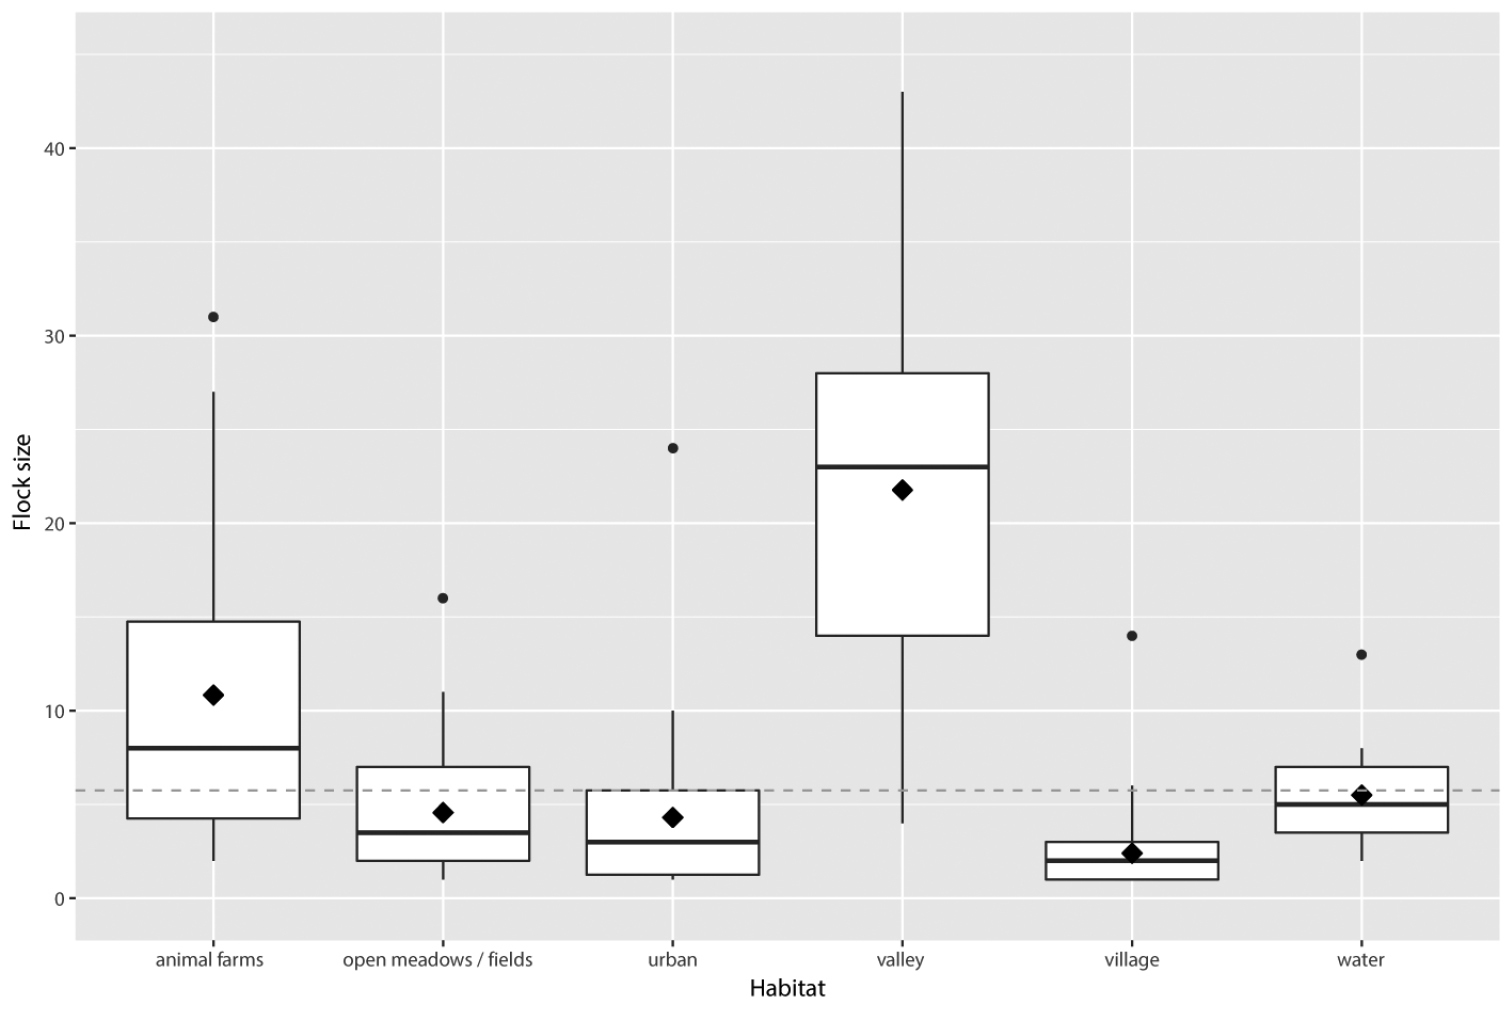
Flock size of Turkey Vultures in relation to habitat type. The y-axis represents the estimated variable. The boxplots show the median (bar in middle of rectangles), mean (black rhombus), upper and lower quartiles, and extreme values. The horizontal dashed line is the average values of flock sizes considering all cases. |