|
||
|
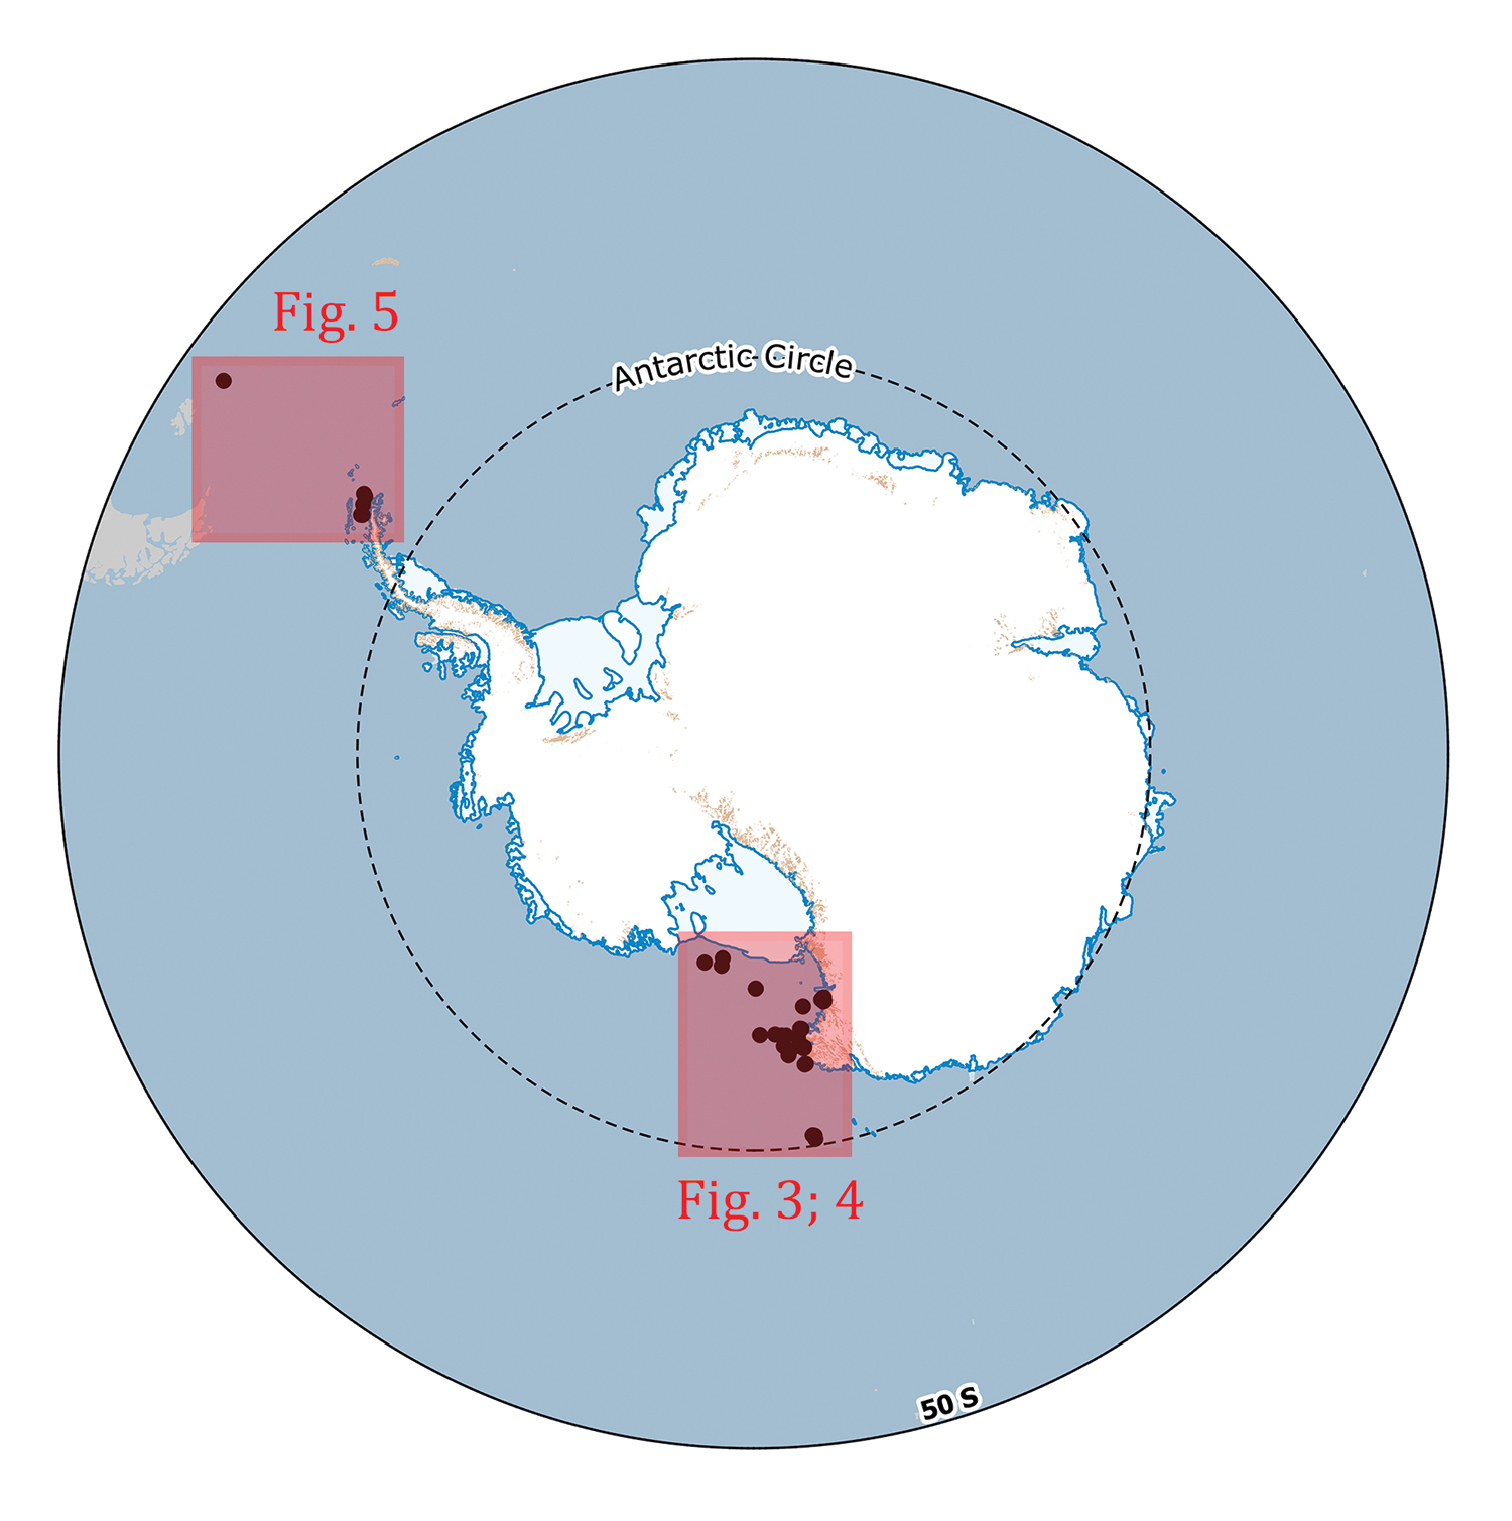
Overview map depicting the wideness of the area containing the sampling stations of the dataset. Areas in red are shown in detail in figures 3, 4 and 5. |
|
||||||||
| Part of: Cecchetto M, Alvaro MC, Ghiglione C, Guzzi A, Mazzoli C, Piazza P, Schiaparelli S (2017) Distributional records of Antarctic and sub-Antarctic Ophiuroidea from samples curated at the Italian National Antarctic Museum (MNA): check-list update of the group in the Terra Nova Bay area (Ross Sea) and launch of the MNA 3D model ‘virtual gallery’. ZooKeys 705: 61-79. https://doi.org/10.3897/zookeys.705.13712 |