|
||
|
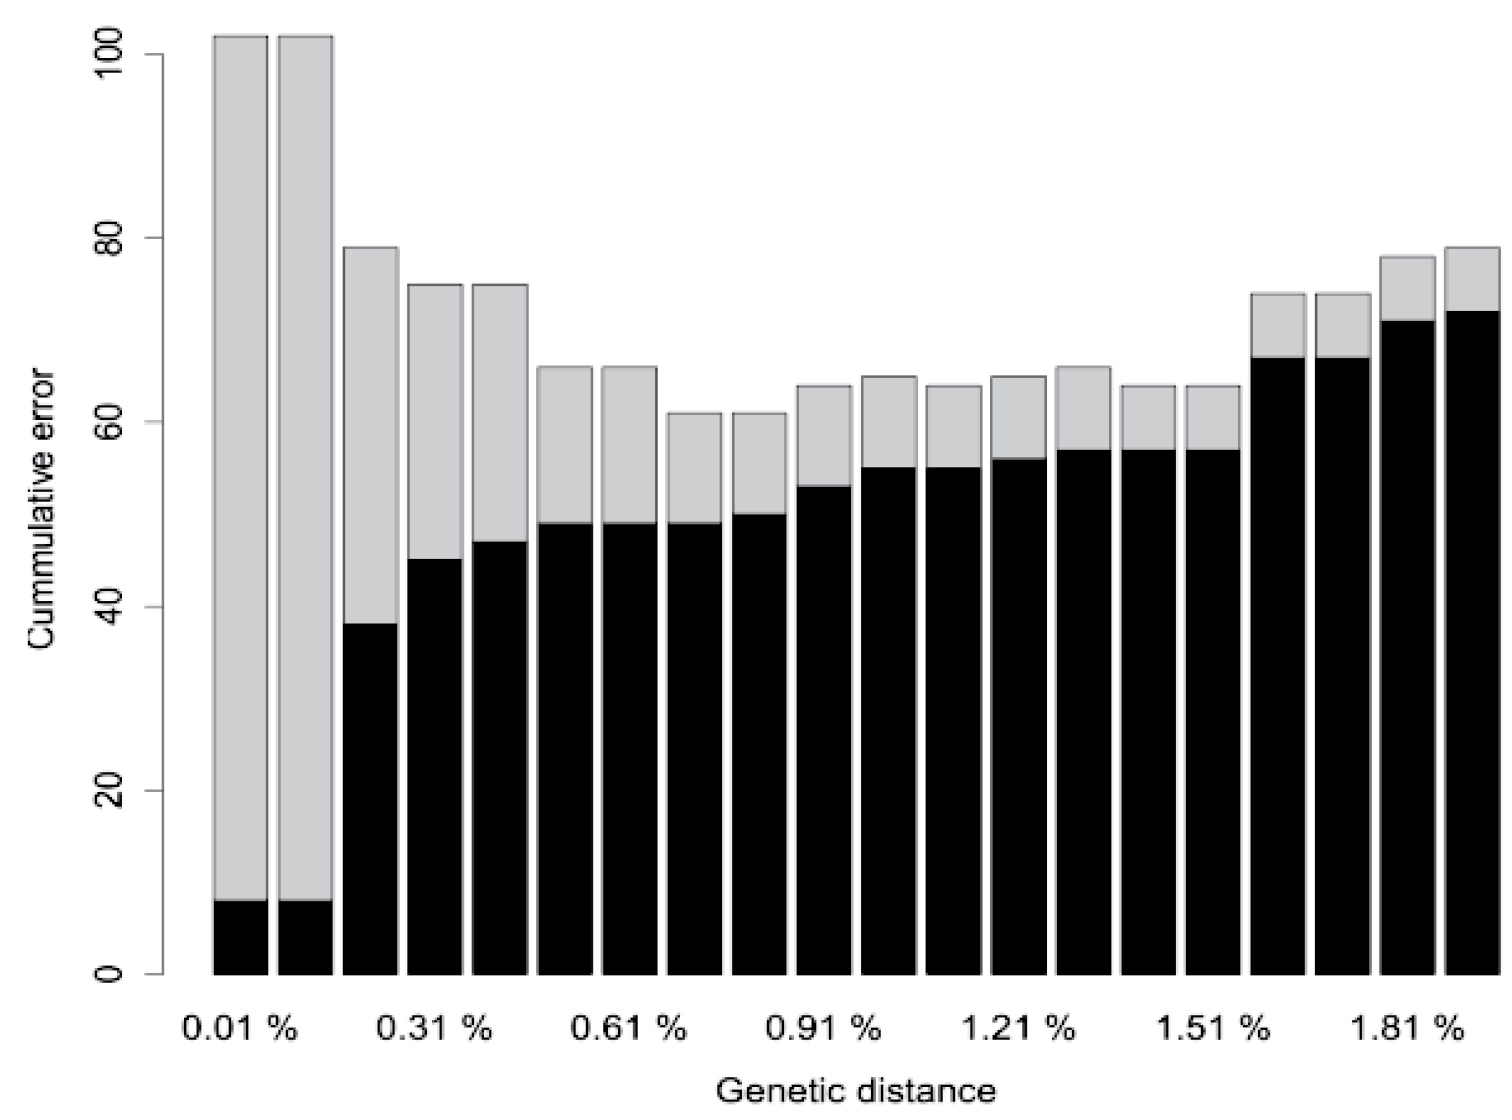
Determination of the threshold genetic distance for species identification. False positive (grey) and false negative (black) identification error rates summed across a range of distance thresholds from 0.01 to 1.9 %. The cumulative error plot indicates the transition between intraspecific and interspecific distances, the genetic distance corresponding to the least cumulative error (1.51 %) showing the appropriate threshold value for the dataset. |