|
||
|
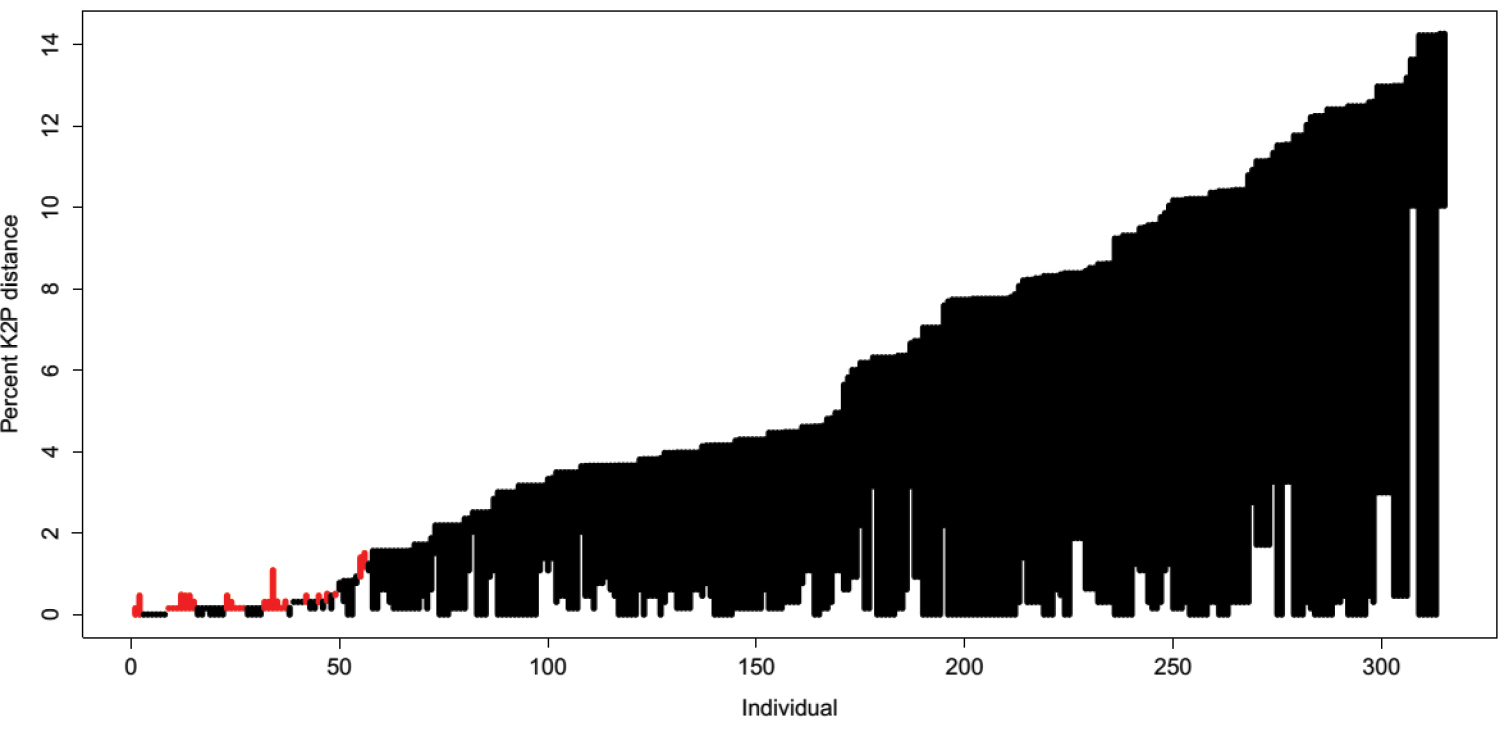
Evaluation of barcode gap in the dataset. Line plot of the barcode gap for the 315 Cyprinidae individuals. The black lines indicate where the smallest interspecific distance is longer than the longest intraspecific distance (bottom of line value), thus showing the existence of a barcode gap. The red lines show where this pattern is reversed. |