|
||
|
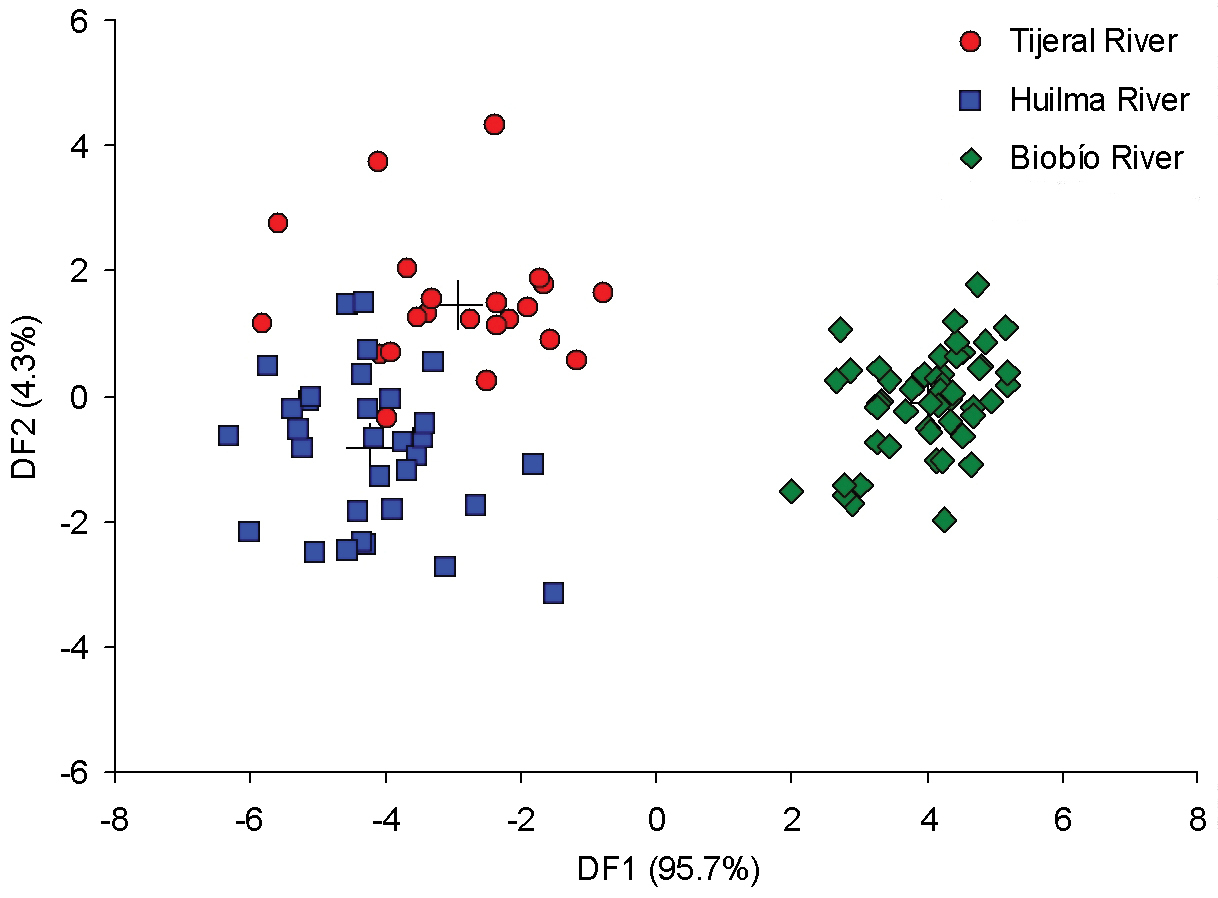
Scatterplot for individual scores from Discriminant Function Analysis (DF1 on DF2) of three Trichomycterus areolatus populations from southern Chile according to 17 truss measurements derived from a truss network. Crosses indicate group centroids. |
|
||||||||
| Part of: Colihueque N, Corrales O, Yáñez M (2017) Morphological analysis of Trichomycterus areolatus Valenciennes, 1846 from southern Chilean rivers using a truss-based system (Siluriformes, Trichomycteridae). ZooKeys 695: 135-152. https://doi.org/10.3897/zookeys.695.13360 |