|
||
|
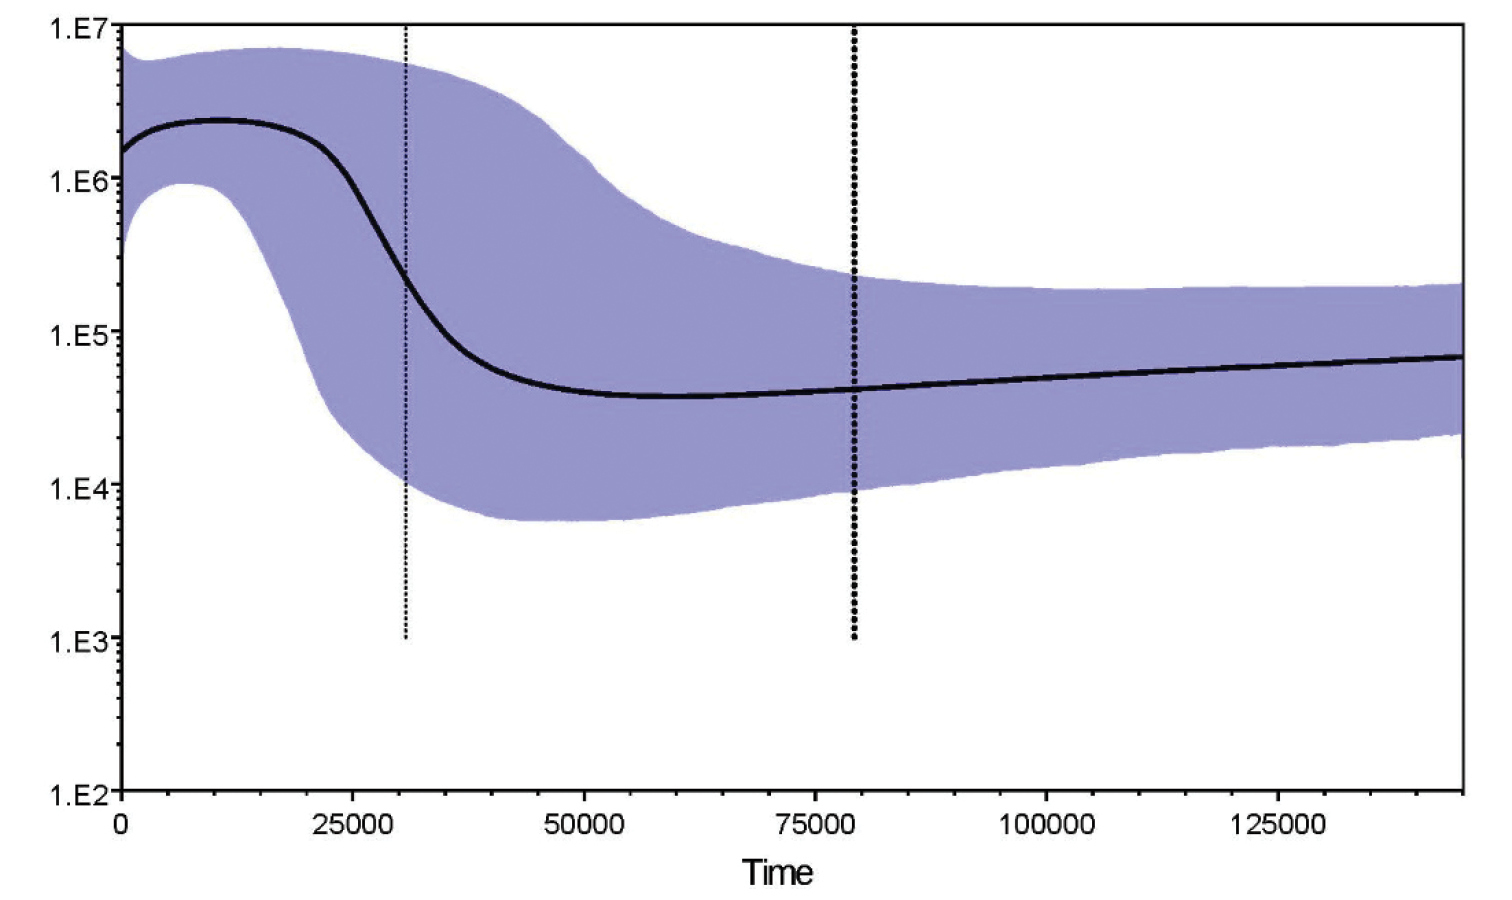
Bayesian skyline plots showing NefT (Nef=effective female population size; T=generation time) changes through time in J. grypotus populations. Black lines are median estimates of NefT; light lines represent the upper and lower 95% highest posterior density (HPD) limits of NefT. |