|
||
|
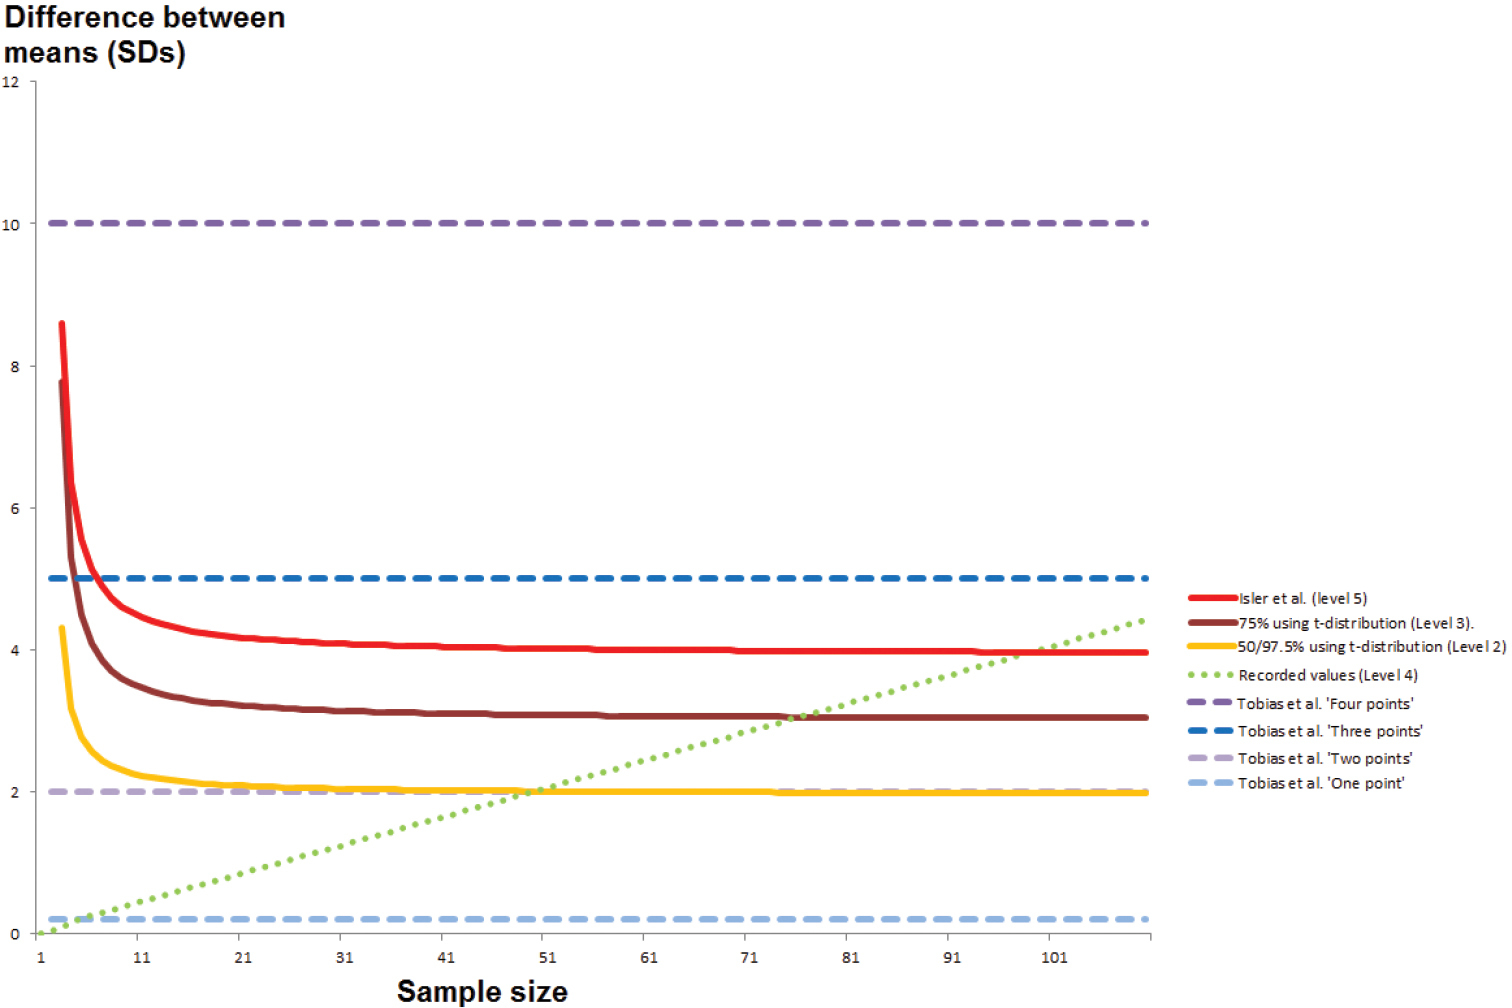
Graph showing relationship between sample size (x-axis) and numbers of effective SD differences between means or effect sizes (y-axis) required in order to pass a test of diagnosability shown in the legend. Dashed lines represent the four boundaries for affording scores under Tobias et al. (2010). Solid lines represent the Levels 2, 4 and 5 (Isler et al. 1998) tests of diagnosis. The dotted line is based on diagnosability using actual values, for a pairwise comparison of two populations which marginally meet the Level 5 test, where results falling outside a 95% distribution are averaged out in their linear occurrence in the data set. In reality, a data point outside of the 95% distribution could occur randomly at any point along this line, including as the first data point or as data point numbers 96–100. Differences arising from usage of unpooled versus pooled standard deviations are ignored for purposes of simplicity. |