|
||
|
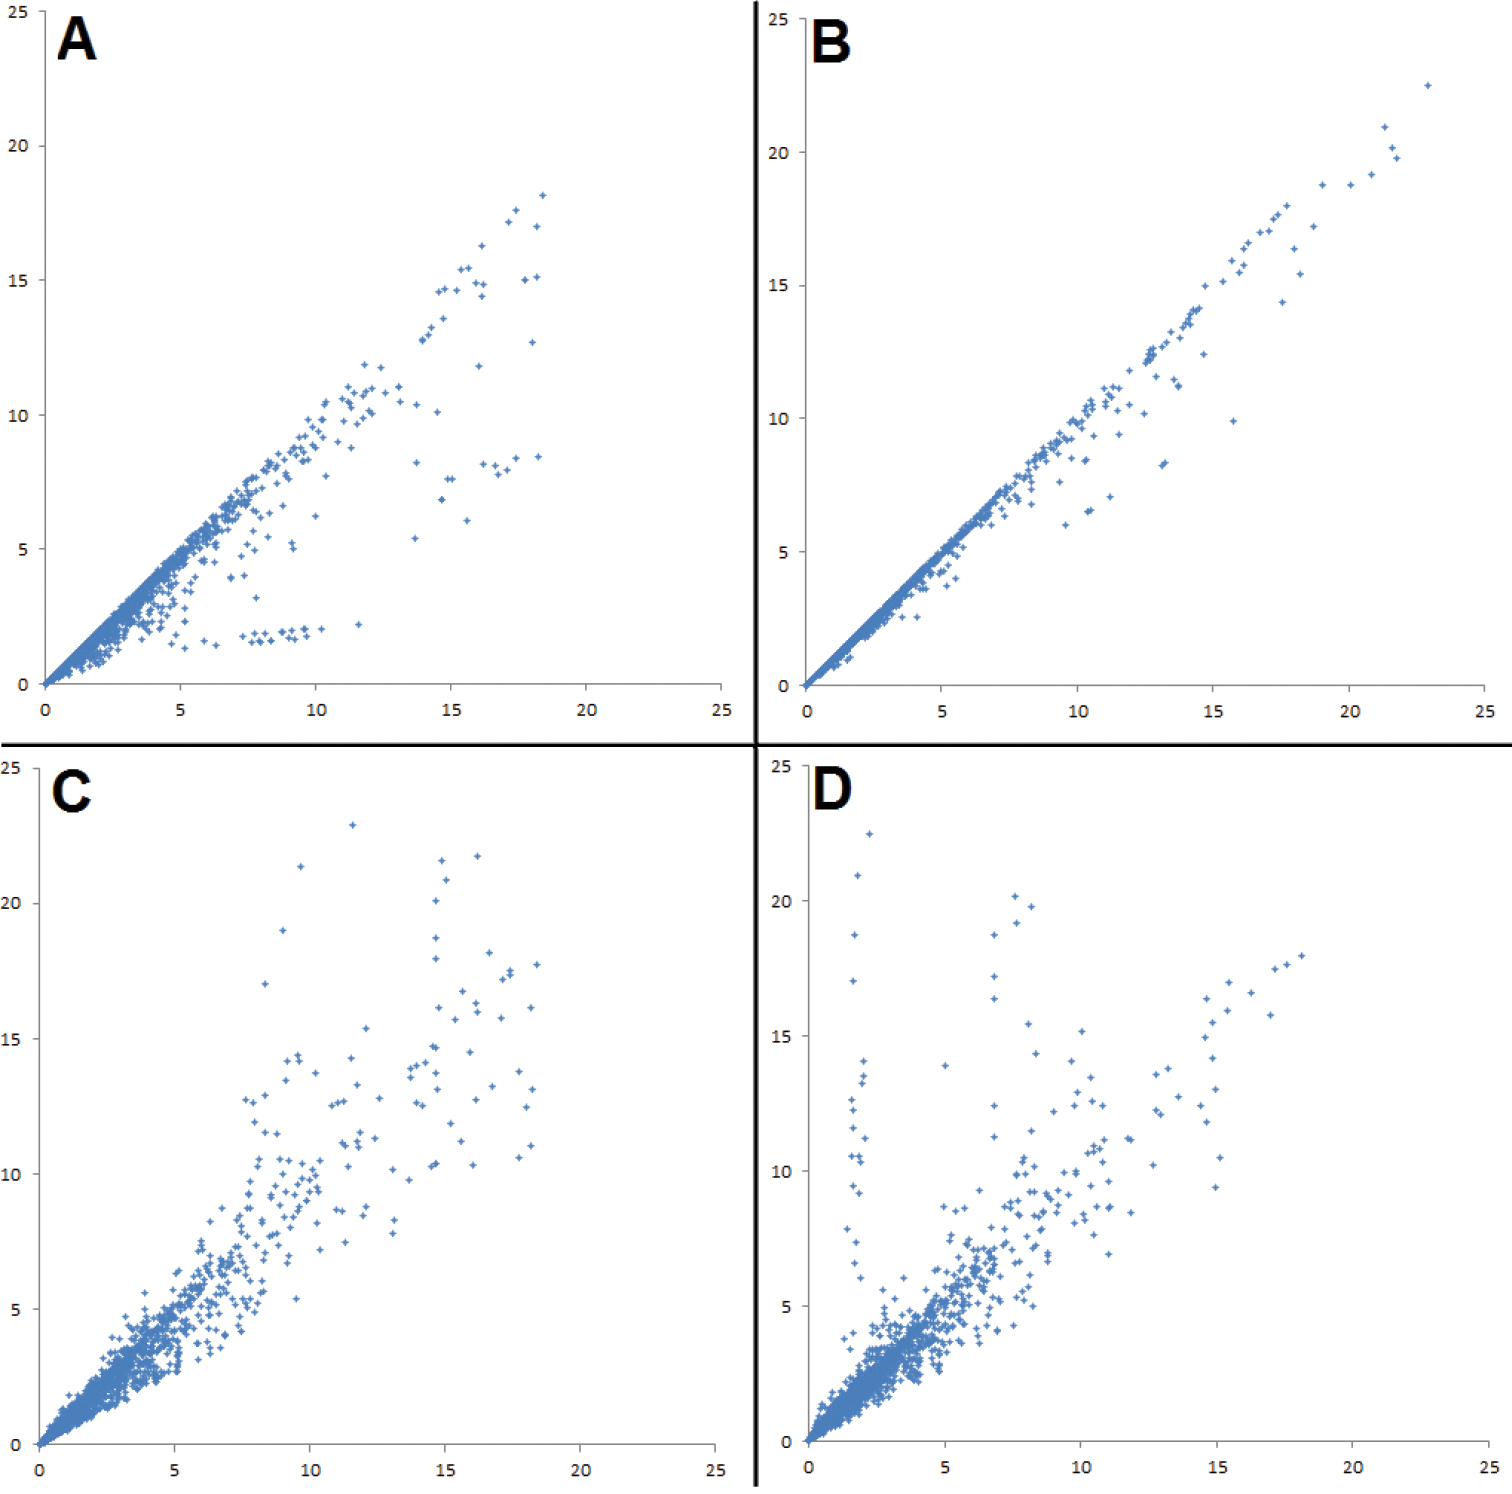
Scatter-graphs showing the effects of applying different corrections of effect size on the entire vocal data set. Each axis shows effect size, measured in a different way. A Controlling for sample size using unpooled data – x-axis: bare unpooled effect size; y-axis: controlled unpooled effect size B Controlling for sample size using pooled data – x-axis: bare pooled effect size; y-axis: controlled pooled effect size C Using pooled versus unpooled effect sizes without controlling for sample size – x-axis: bare unpooled effect size; y-axis: bare pooled effect size D Using pooled versus unpooled effect sizes and controlling for sample size – x-axis: controlled unpooled effect size; y-axis: controlled pooled effect size. A single data point of greater than 25 effect sizes was excluded to improve presentation of the results. |