|
||
|
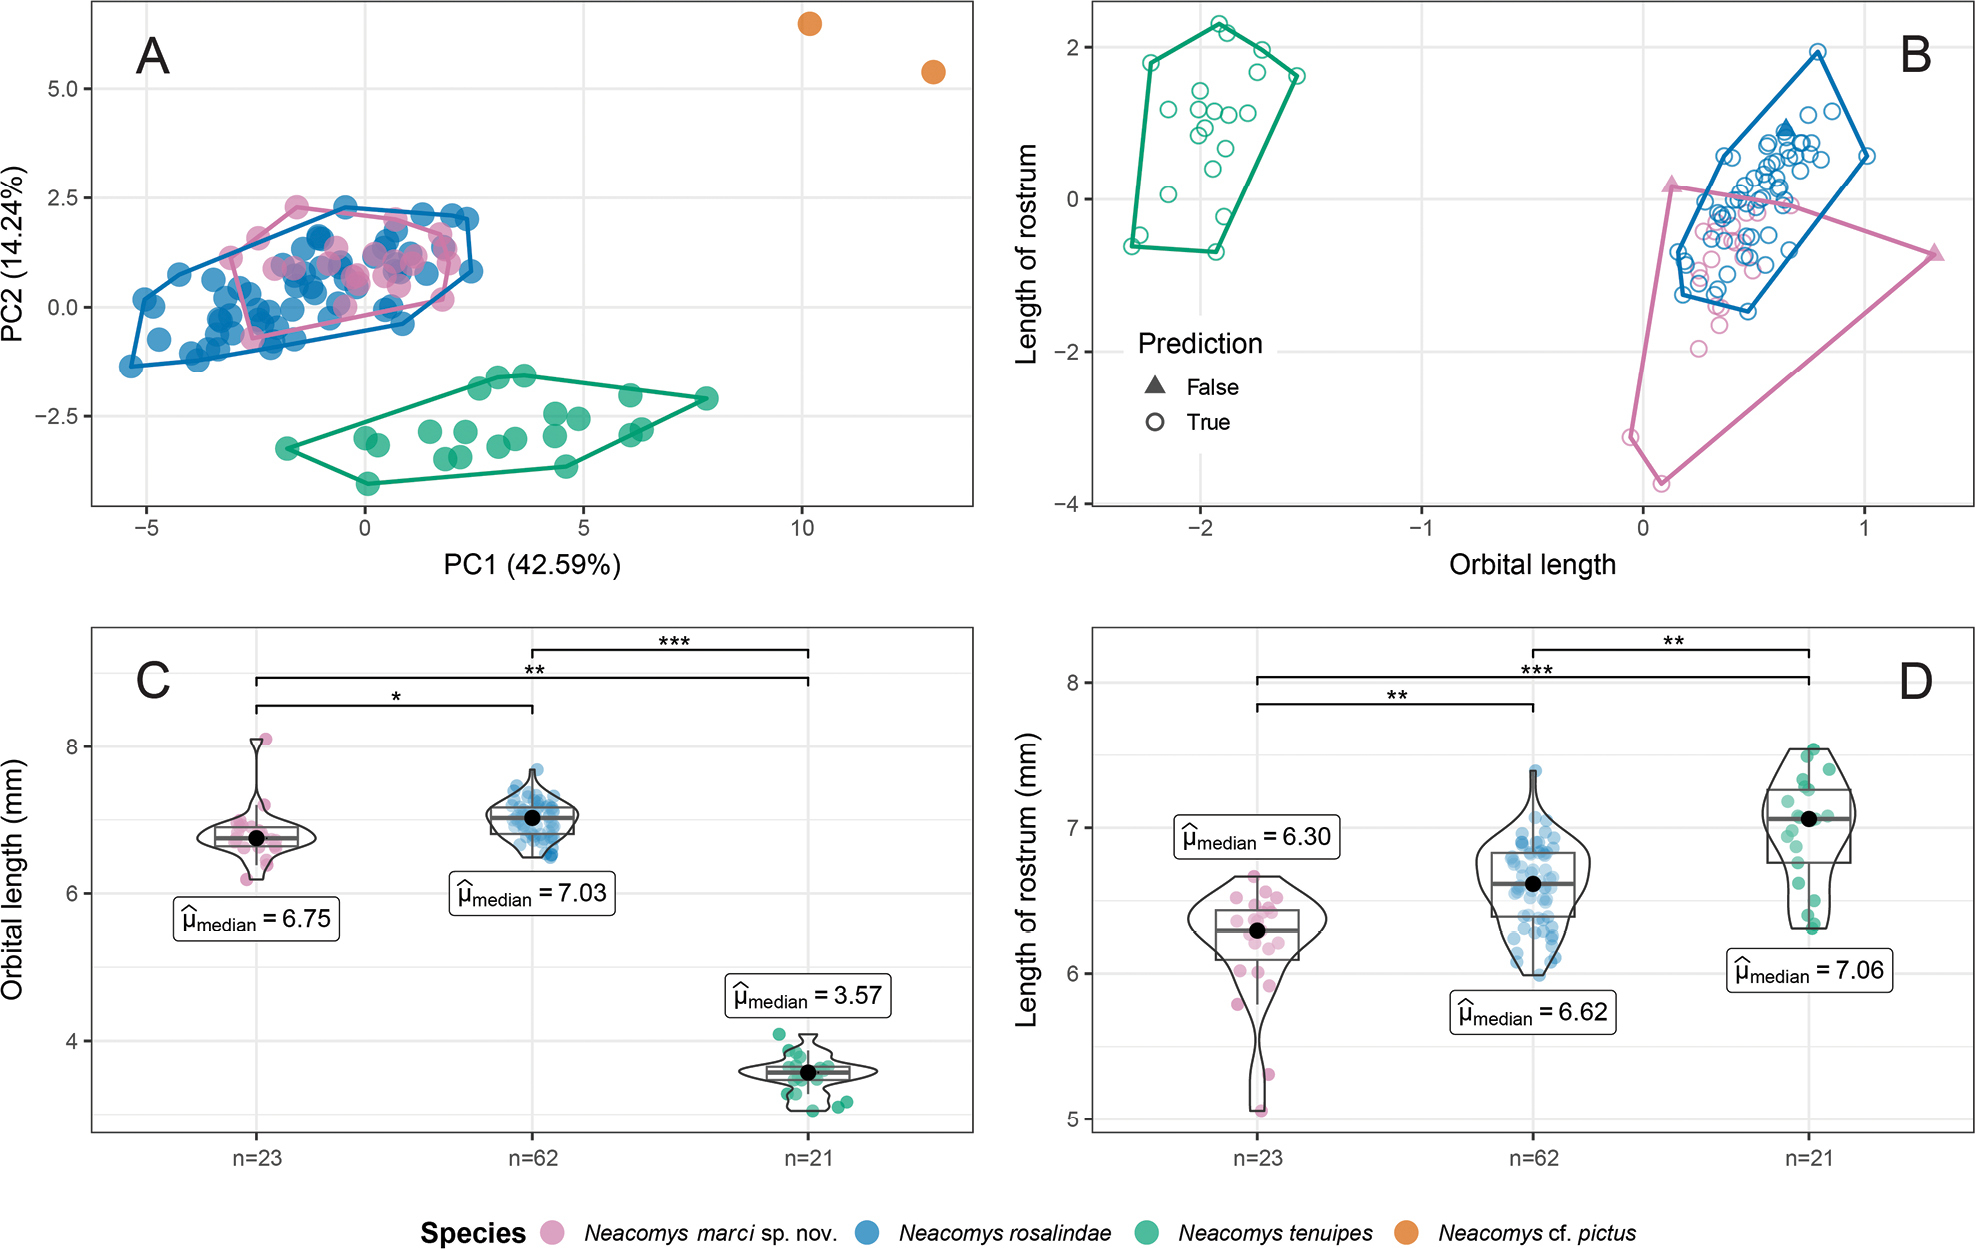
Morphometric and statistical analyses A scatterplots of the Principal Components B the K neighbor discriminant analyses. Each taxon is enclosed by a convex hull, and color codes are detailed in the legend C, D the distribution of the data is shown in a violin boxplot; the median of each taxon character is indicated with a black dot. Only statistically significant differences among taxa are shown with the p-adjusted Holm method (* p < 1e-3, ** p < 1e-4, *** p < 1e-9). |