|
||
|
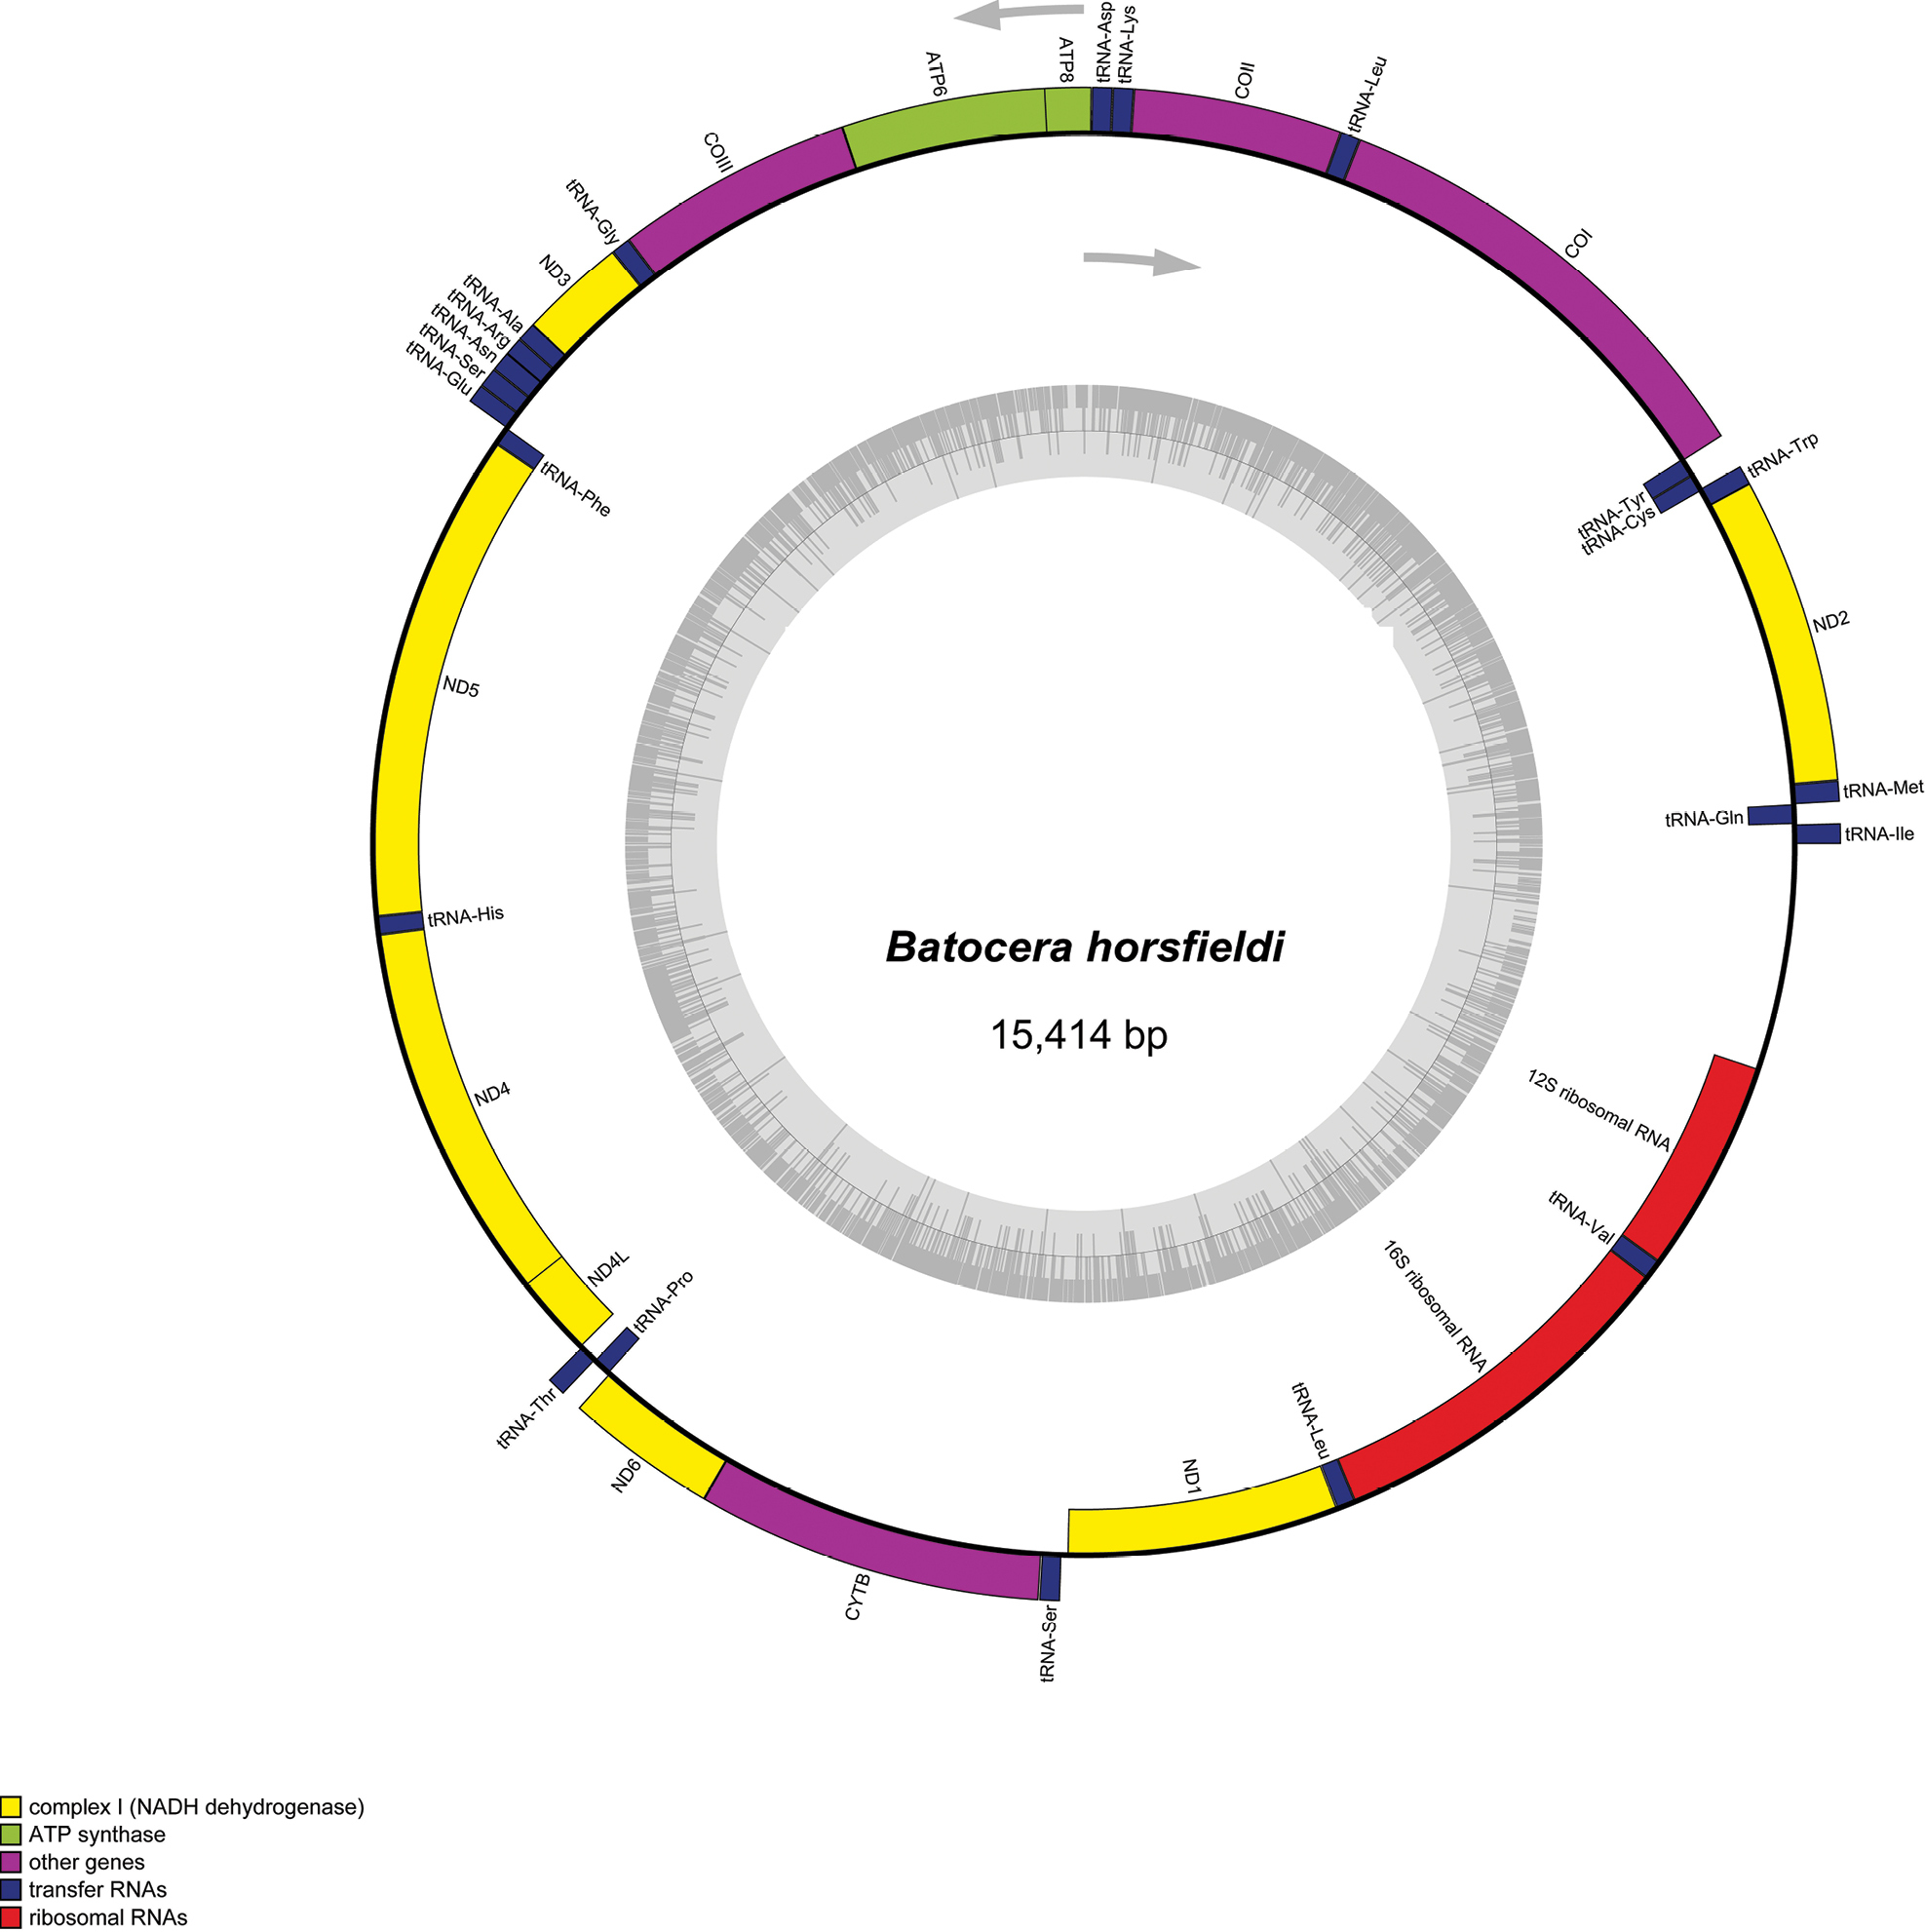
Mitogenome map of B. horsfieldi. ND1, ND2, ND3, ND4, ND4L, ND5 and ND6 are in yellow. COI, COII and COIII are in magenta. ATP6 and ATP8 are in green. CYTB is in pink. rrnl and rns are in red. all tRNAs are in dark blue and the control region is in white. Figure 1 was generated by Geneious v.11.0.2 by referring to Greiner et al. (2019). |