|
||
|
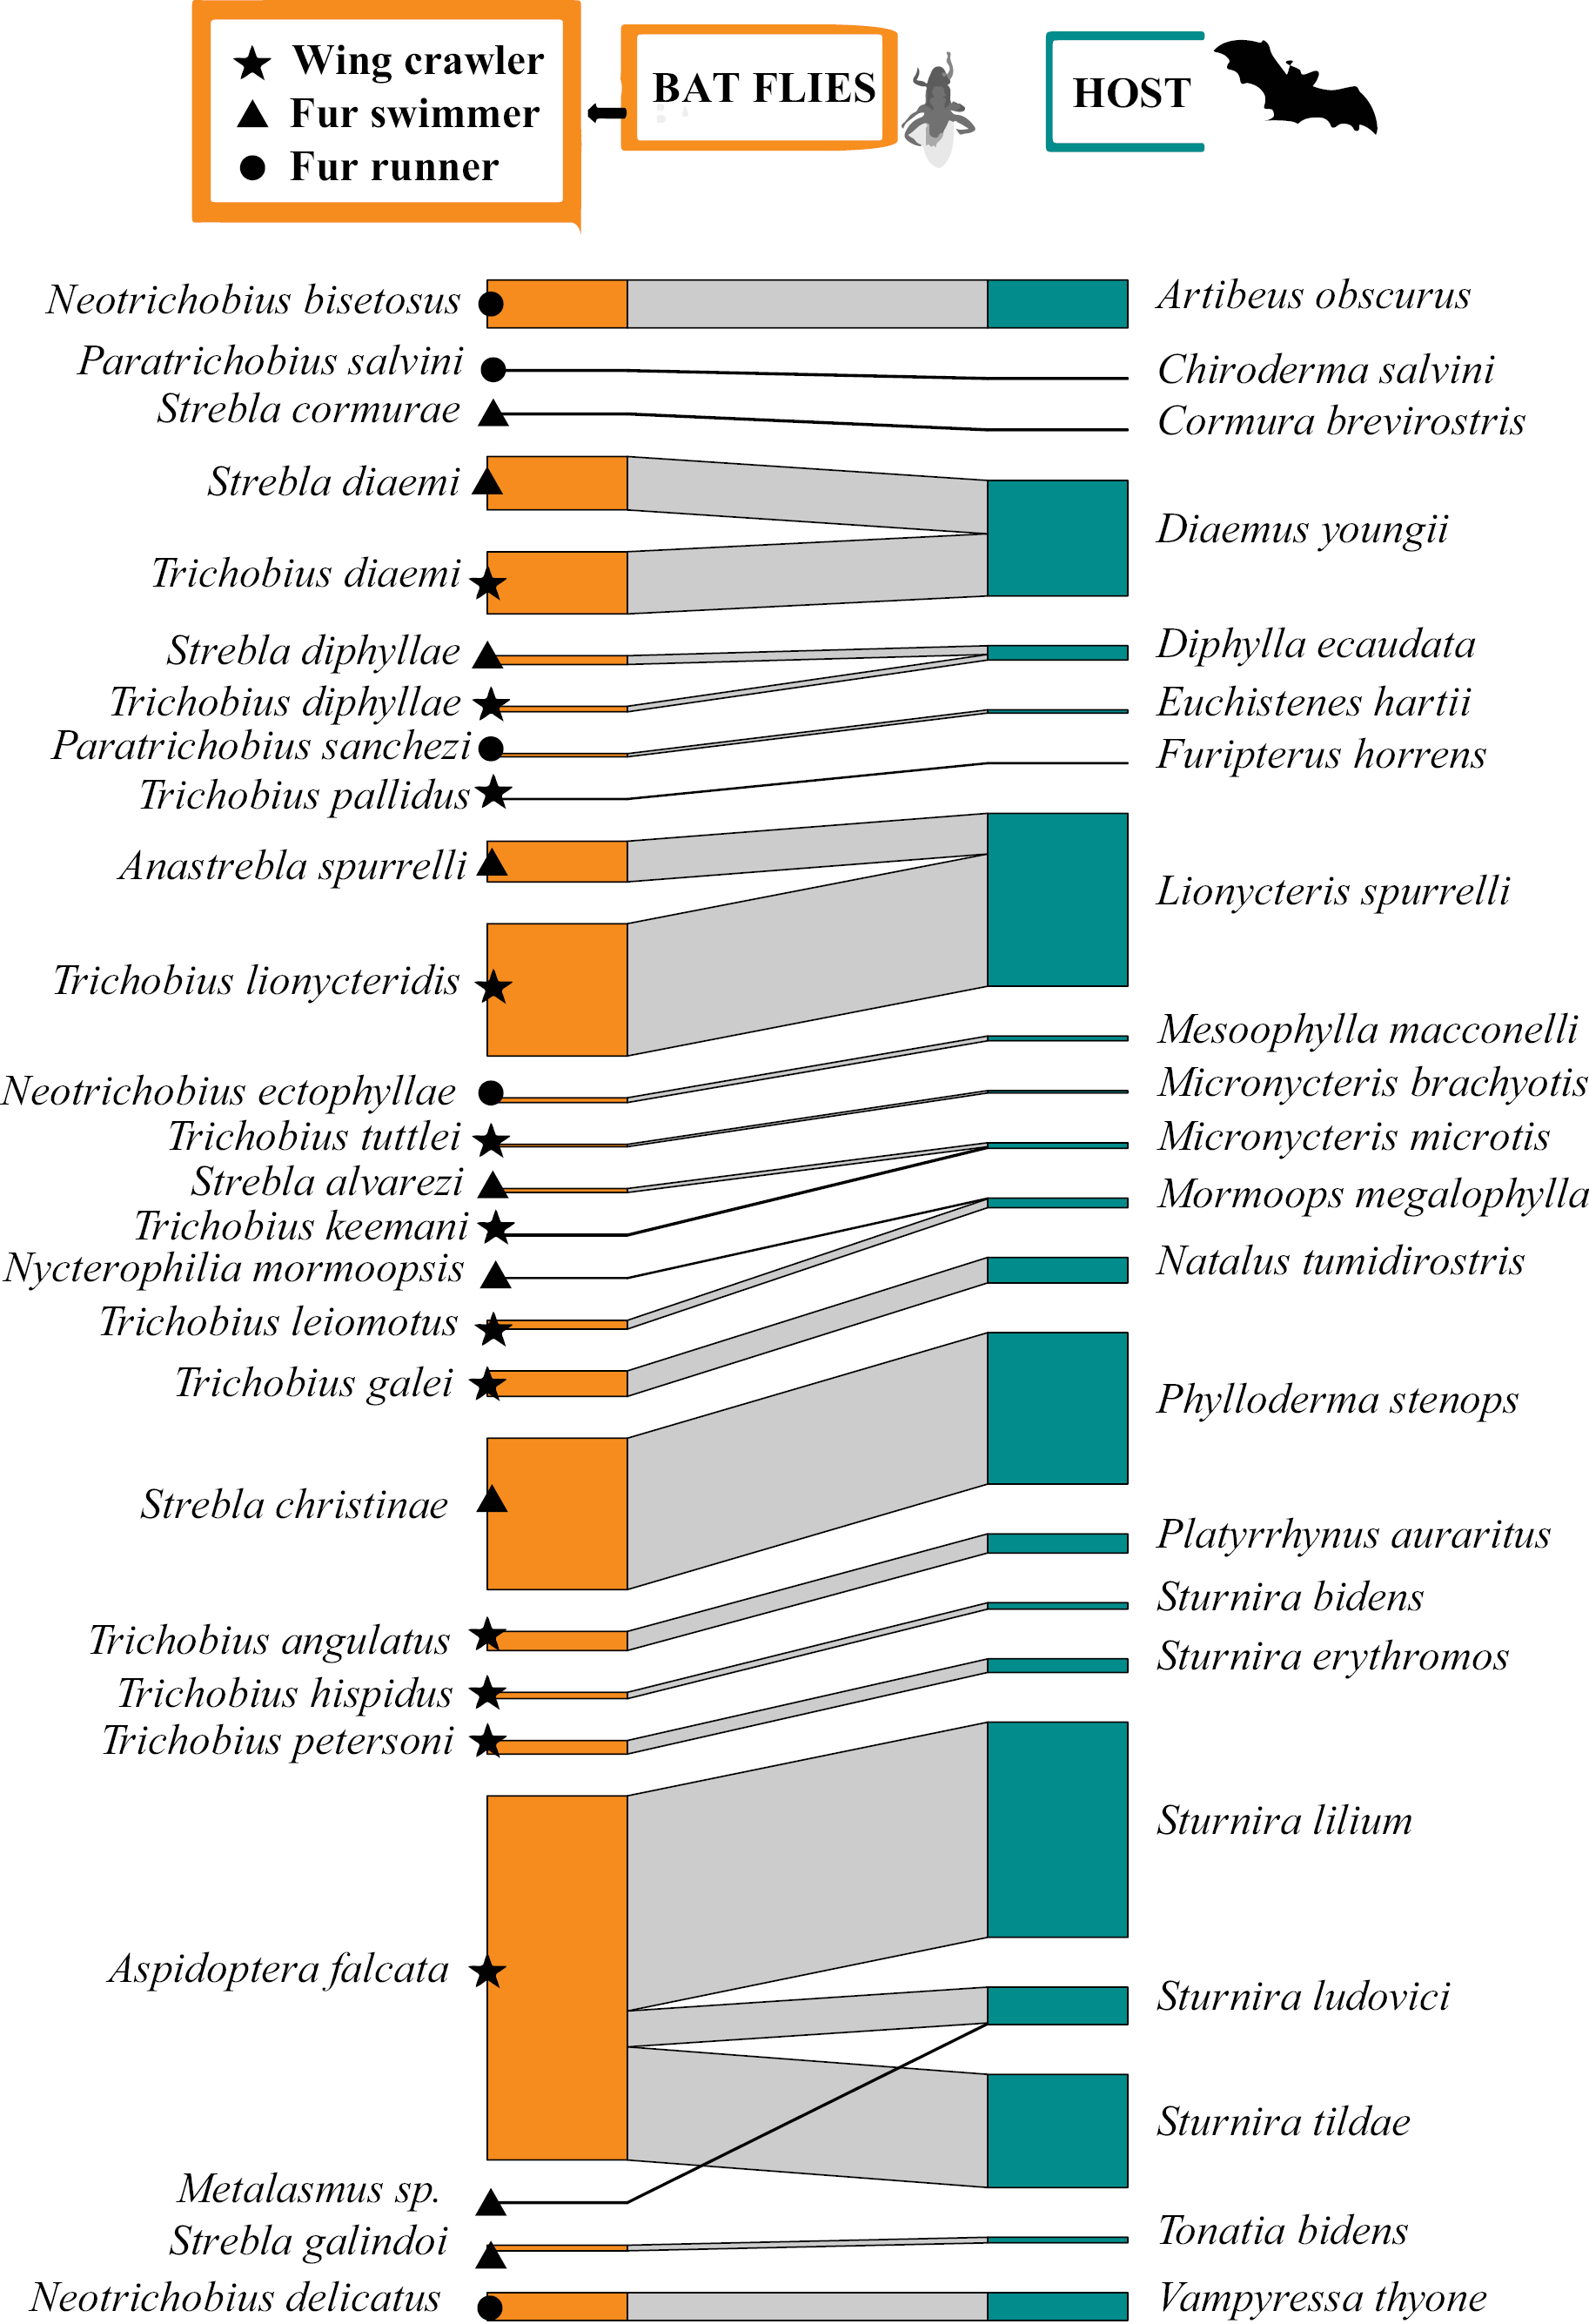
Quantitative bipartite bat-fly network (Module 3 - Streblidae). The size of the left bar (orange) represents the abundance (number of individuals) of bat flies per observed species and the size of the right bar (green) represents the abundance of bats for which the sample was obtained. The width of the black lines/bars indicates the frequency of interactions. |