|
||
|
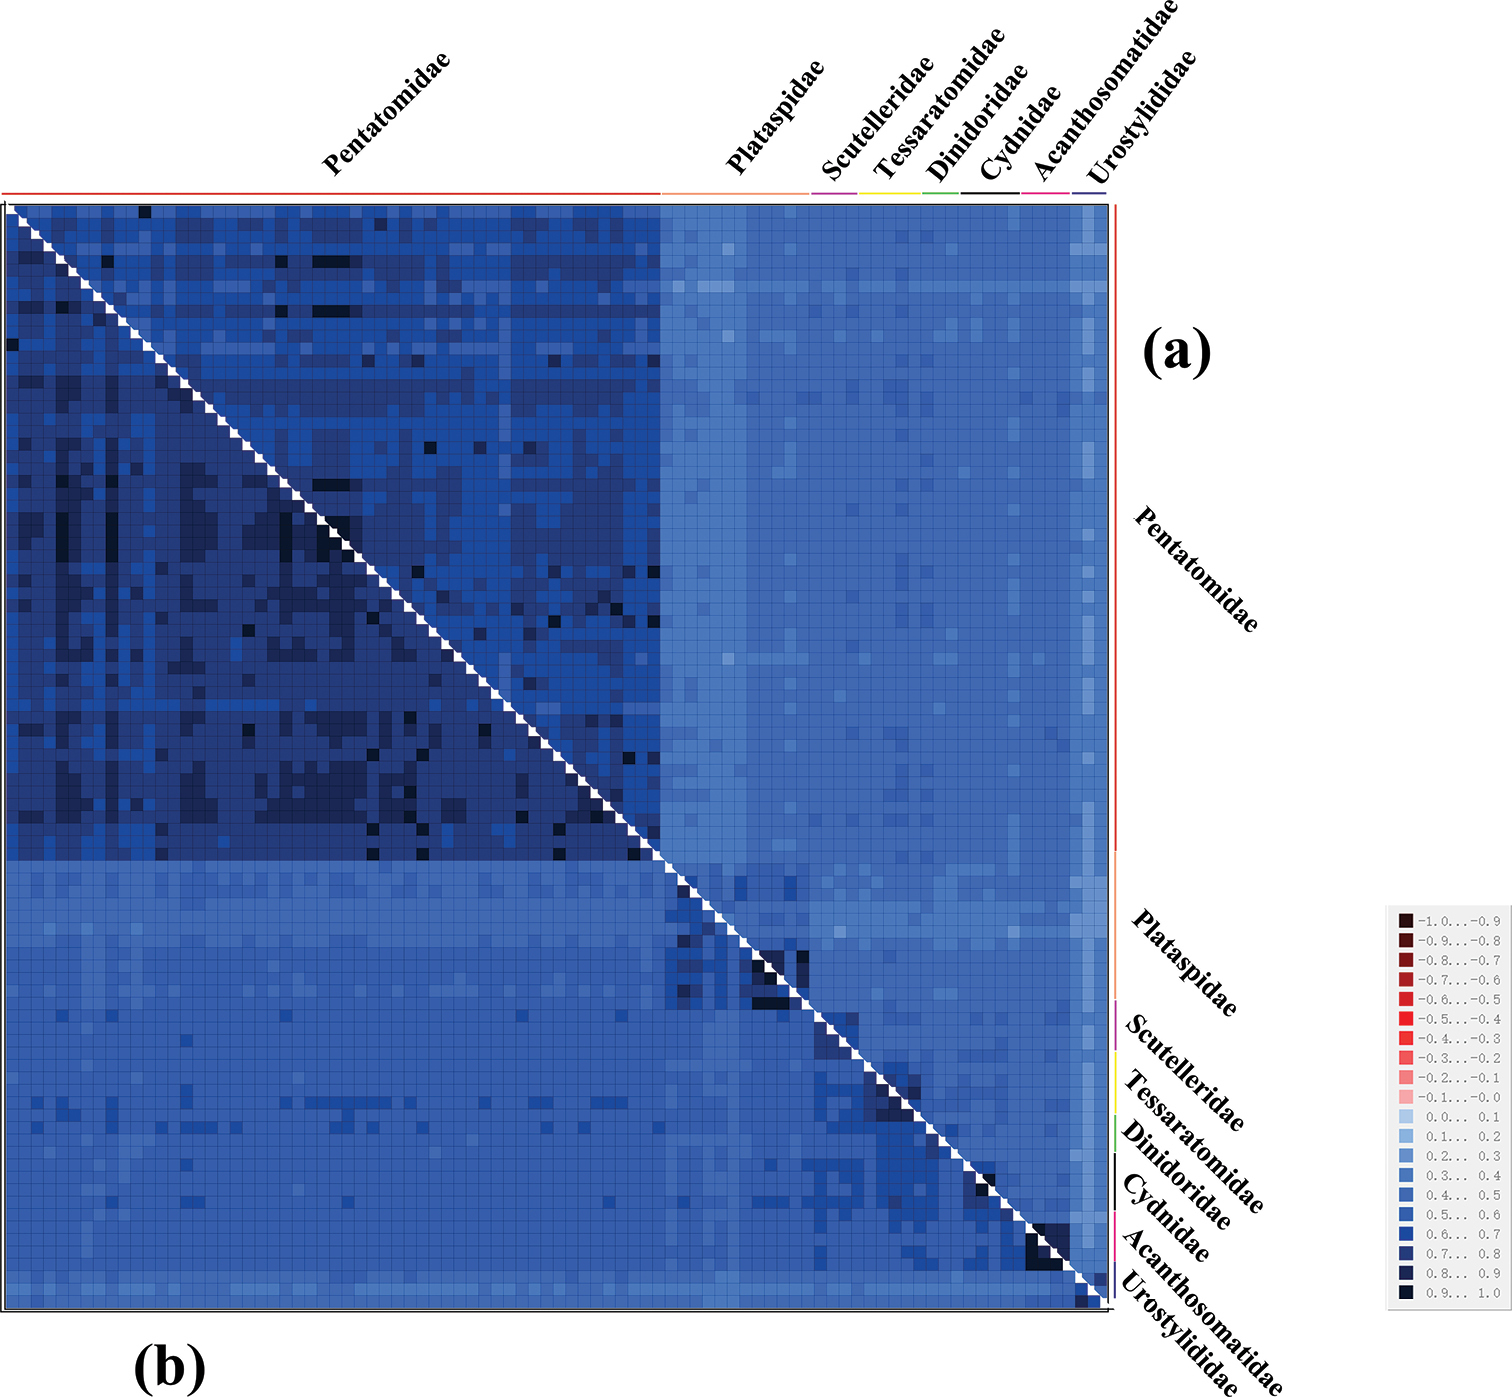
AliGROOVE analysis of 89 Pentatomoidea species a based on PCG123 b based on PCG12. The mean similarity score between sequences is represented by colored squares, based on AliGROOVE scores ranging from –1, which indicates a great difference in rates from the remainder of the data set (= heterogeneity, red color) to +1, which indicates rates that matched all other comparisons (blue color, as in this case). |