


(C) 2013 Maarten P. M. Vanhove. This is an open access article distributed under the terms of the Creative Commons Attribution License (CC BY 4.0), which permits unrestricted use, distribution, and reproduction in any medium, provided the original author and source are credited.
For reference, use of the paginated PDF or printed version of this article is recommended.
Citation: Vanhove MPM, Tessens B, Schoelinck C, Jondelius U, Littlewood DTJ, Artois T, Huyse T (2013) Problematic barcoding in flatworms: A case-study on monogeneans and rhabdocoels (Platyhelminthes). In: Nagy ZT, Backeljau T, De Meyer M, Jordaens K (Eds) DNA barcoding: a practical tool for fundamental and applied biodiversity research. ZooKeys 365: 355–379. doi: 10.3897/zookeys.365.5776
Some taxonomic groups are less amenable to mitochondrial DNA barcoding than others. Due to the paucity of molecular information of understudied groups and the huge molecular diversity within flatworms, primer design has been hampered. Indeed, all attempts to develop universal flatworm-specific COI markers have failed so far. We demonstrate how high molecular variability and contamination problems limit the possibilities for barcoding using standard COI-based protocols in flatworms. As a consequence, molecular identification methods often rely on other widely applicable markers. In the case of Monogenea, a very diverse group of platyhelminth parasites, and Rhabdocoela, representing one-fourth of all free-living flatworm taxa, this has led to a relatively high availability of nuclear ITS and 18S/28S rDNA sequences on GenBank. In a comparison of the effectiveness in species assignment we conclude that mitochondrial and nuclear ribosomal markers perform equally well. In case intraspecific information is needed, rDNA sequences can guide the selection of the appropriate (i.e. taxon-specific) COI primers if available.
mitochondrial DNA, Monogenea, primer design, ribosomal DNA, Rhabdocoela, turbellarians
Many biodiversity studies tend to focus on conspicuous fauna, ignoring the vast species diversity and ecological importance of less sizeable animals such as parasitic or meiofaunal taxa, including flatworms (
It is important to consider the characteristics of the COI gene, warranting its common use as a barcoding gene. Being a mitochondrial gene, it has a maternal inheritance, lacks introns, undergoes no recombination, and primers are available for potentially much of the animal kingdom (
The acquisition of COI markers for flatworms has opened up many new research avenues. COI data have proven useful in parasitic, meiofaunal or other flatworms (e.g.
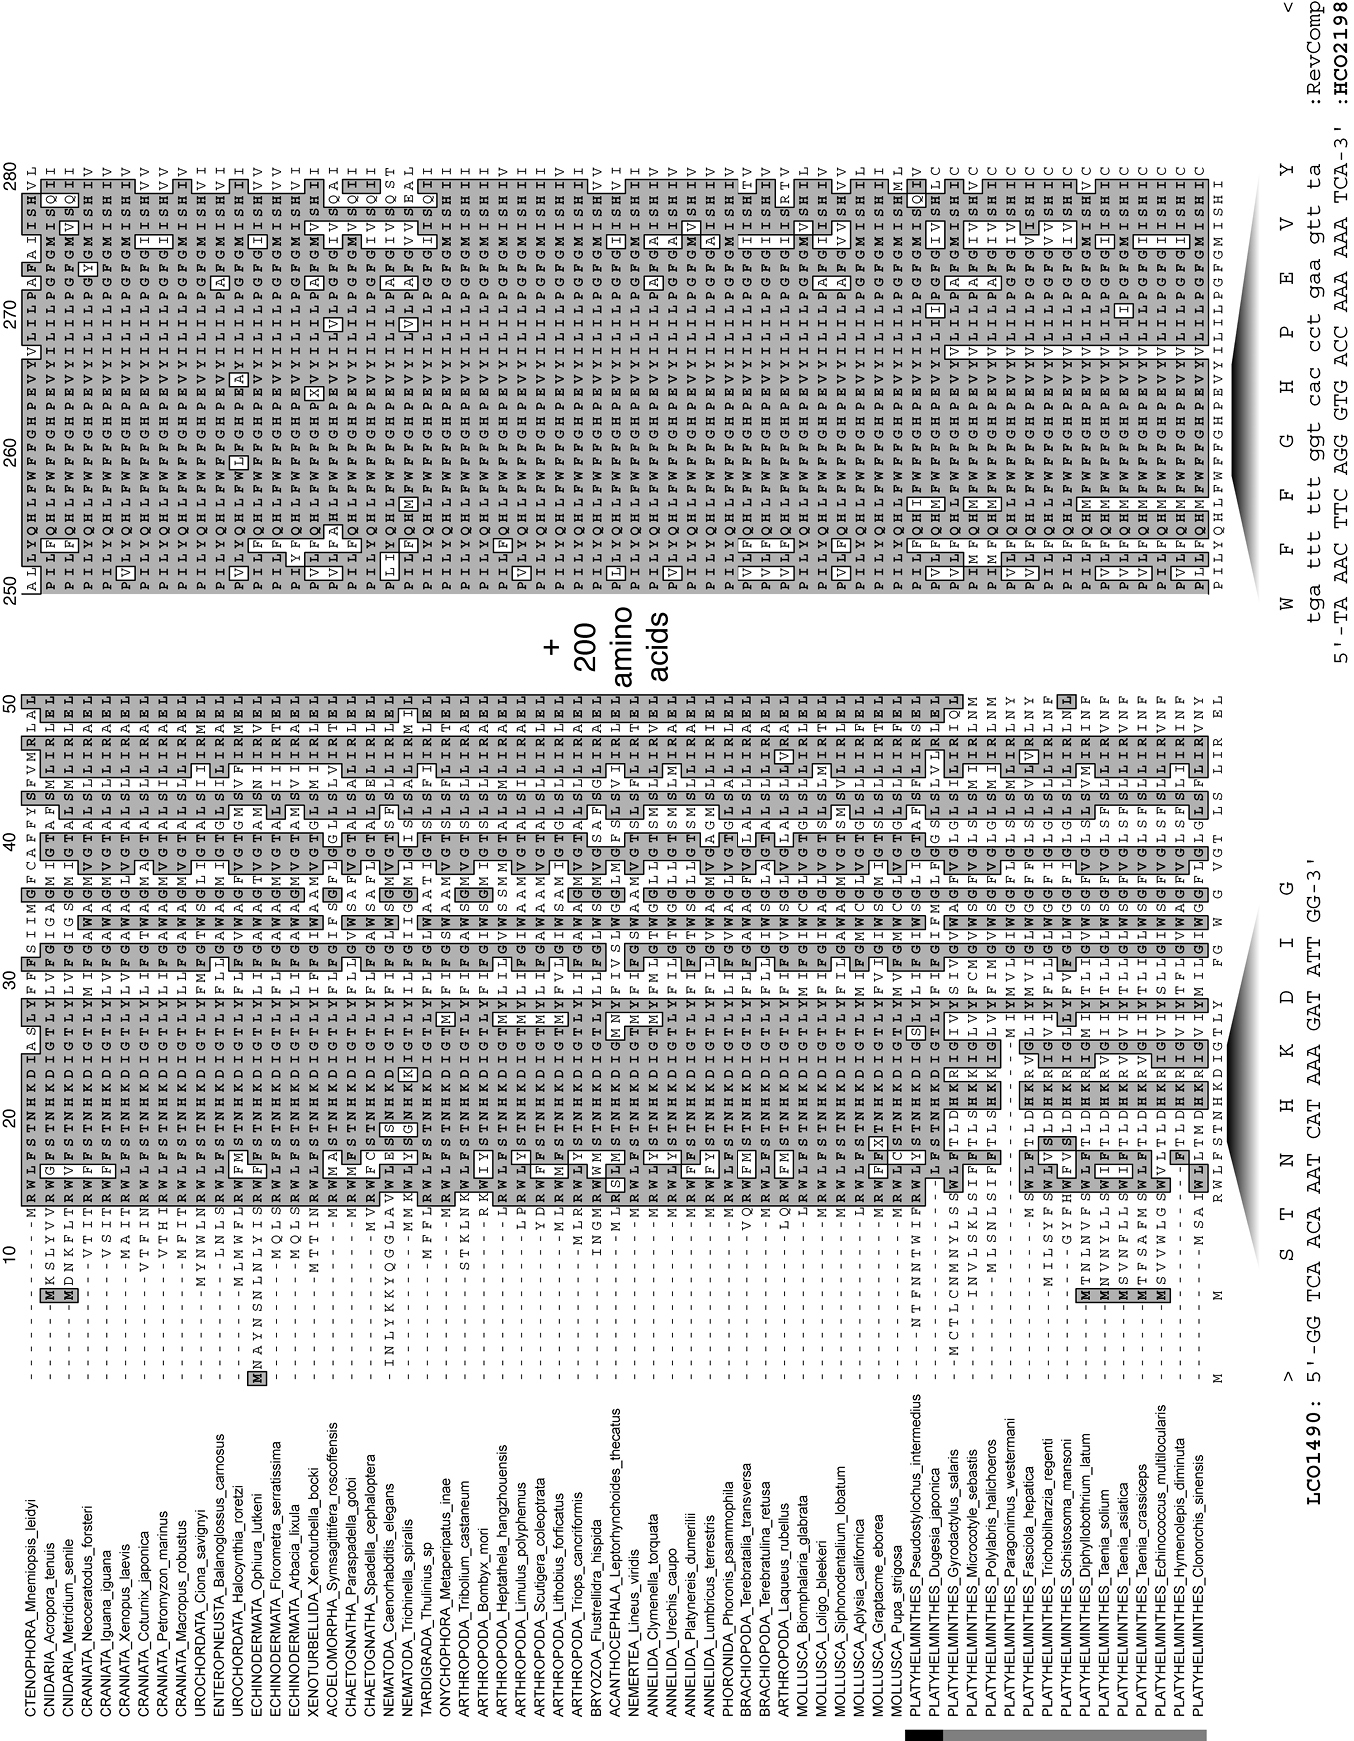
Fragments of an alignment of complete mitochondrial cytochrome c oxidase subunit I genes, as amino acids, for a diversity of metazoan taxa indicating the positions of the
Monogenea is a species-rich group within the parasitic flatworms, a lot of the diversity of which remains unexplored. Indeed, only an estimated 2 200 – 5 000 species have been described (
Rhabdocoela is one of the most species-rich clades of free-living “turbellarian” flatworms with over 1 500 described species (
Various fragments of the nuclear ribosomal DNA, like the genes for 18S, 5.8S and 28S rRNA, and the internal transcribed spacers ITS-1 and ITS-2, evolve at different rates, making them suitable for assessing genetic divergence at various levels (
In monogeneans, various portions of the rDNA, and most often the spacer regions ITS-1 and ITS-2, are considered to adequately mirror differences between morphologically recognized species (
In rhabdocoels, the 18S and 28S rDNA has been used extensively for phylogenetic analysis (
From these examples, it is clear that the various portions of the nuclear rDNA region render it a versatile region for genetic approaches to systematics of both monogeneans and rhabdocoels. An additional advantage is the availability of primers that seem to be flatworm-universal (
A total of 27 species of rhabdocoels(from 21 genera covering 15 out of the 35 rhabdocoel families) were collected from freshwater, marine or brackish water sites. Specimens were collected as described in
DNA was extracted from whole or partial specimens using the QIAamp DNA micro kit (QIAGEN) according to the manufacturer’s instructions. Extracts were stored in duplicates (40 and 20 μl) for each specimen. The
To check for possible contamination we first submitted all sequences of each clone to BLAST search on the NCBI website (http://www.ncbi.nlm.nih.gov). To further identify sequences that did not have a strong match in GenBank we aligned them to a reference dataset of the
Three test cases were analyzed to demonstrate the potential of different markers for DNA barcoding in Monogenea and Rhabdocoela. The first consisted of 33 species from four genera from the monogenean family Diplectanidae infecting groupers from the Indo-Pacific (from
The K2P-distance model (
A BLAST search of the 169 clones that could successfully be sequenced showed that contamination originated both from external DNA sources (Homo sapiens, Bos taurus – the latter possibly stemming from liver fed to flatworm cultures, or from bovine serum albumin used in the laboratory) and from food items eaten by the worms (Arthropoda, Annelida, Rotifera, Cnidaria, Ciliophora). Most rhabdocoels are so small that DNA has to be extracted from whole animals, which potentially results in the amplification of food items present in the animal. Only two sequences could be identified by BLAST as belonging to flatworms. This is, however, not very surprising given that there is currently only one rhabdocoel COI sequence overlapping with the
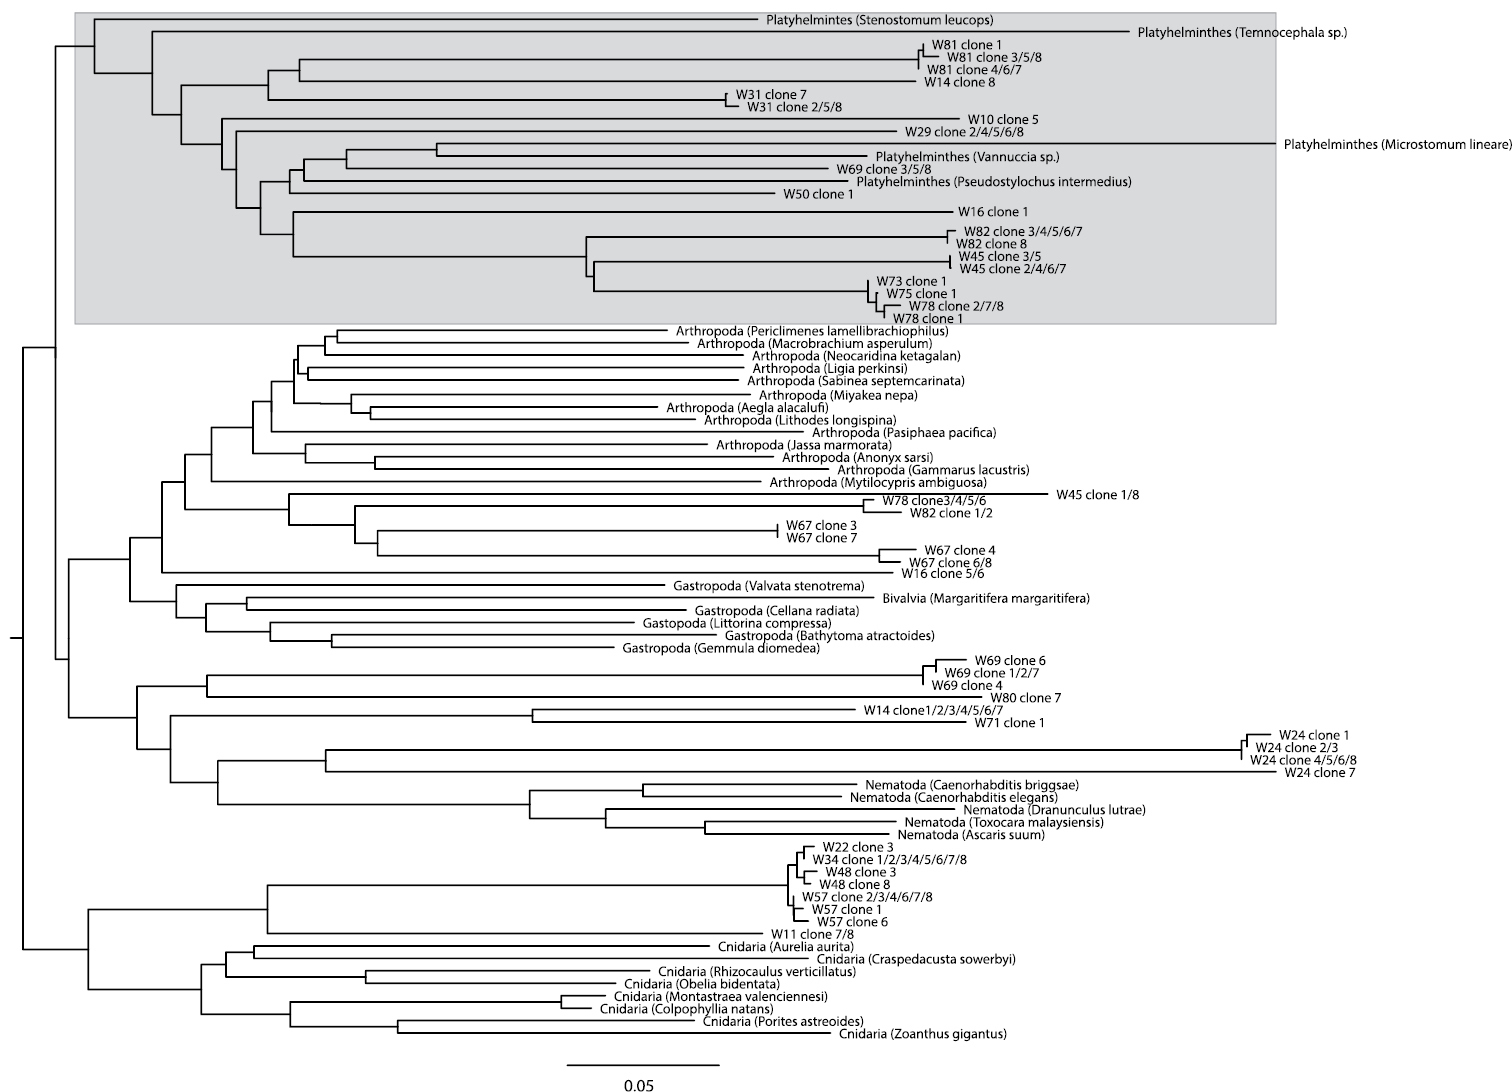
Neighbour-Joining tree based on Kimura 2-parameter (
Histograms of intra- and interspecific K2P-distances are given in Figure 3. Only for the COI gene of Gyrodactylus there was a clear barcoding gap (3-11%). In all other cases there was overlap between the distribution of intra- and interspecific K2P-distances. In the Diplectanidae dataset (test case 1) the BCTh values were 14.5% for COI and 0.74% for 28S (Figure 4). In Gyrodactylus (test case 2) the BCTh was 5.3% for COII, 6.5% for COI and 1.39% for the entire ITS-1 – 5.8S – ITS-2 fragment (Figure 4). Alignment of ITS fragments needs to take into account many indels, even in this dataset with closely related species.
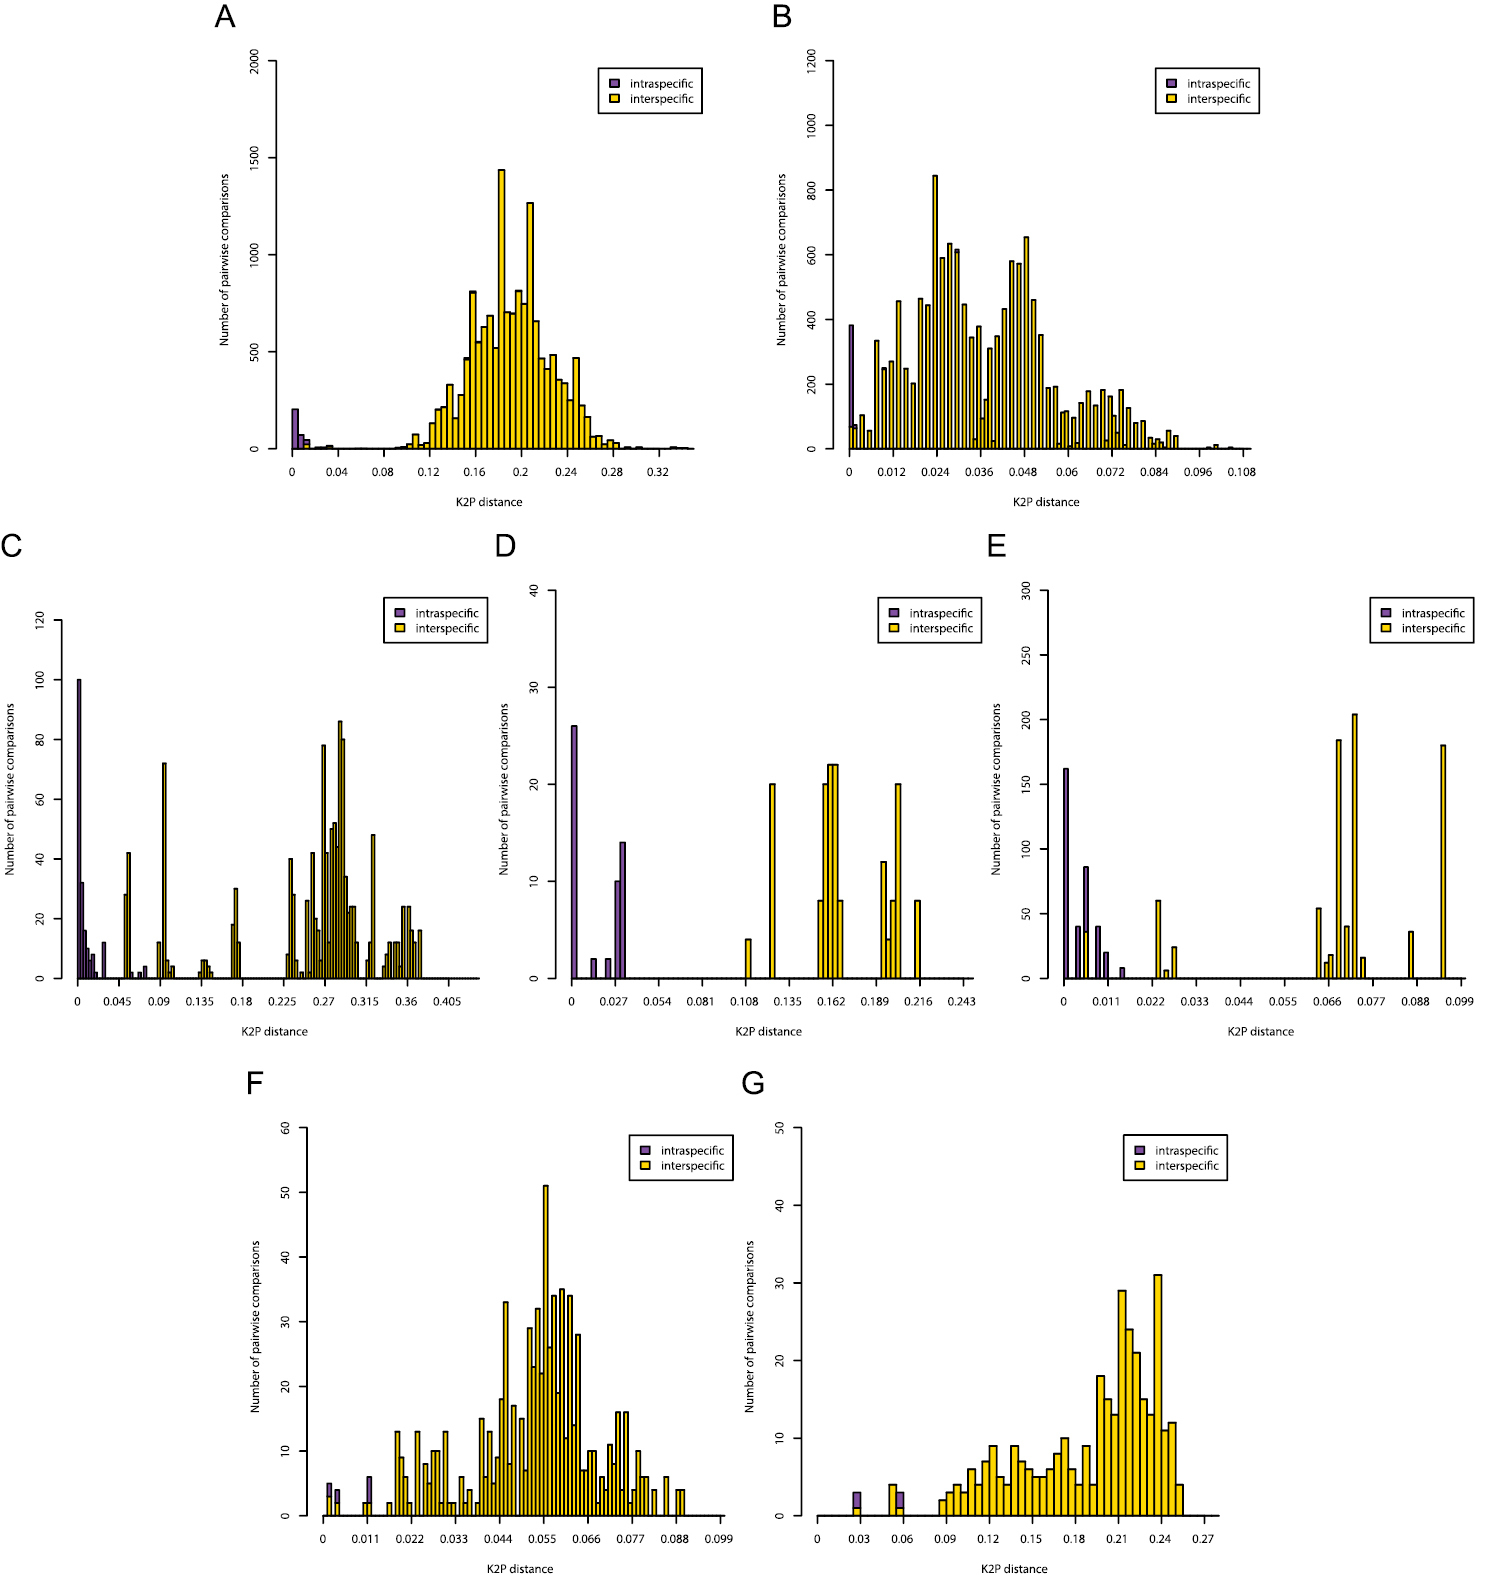
Pairwise distance (K2P) distributions of intra- and interspecific sequence divergences for the COI gene in Diplectanidae (A), 28S rDNA region in Diplectanidae (B), the COII gene in Gyrodactylus (C), the COI gene in Gyrodactylus (D), the ITS rDNA region in Gyrodactylus (E), the 28S rDNA region in Gieysztoria (F) and the ITS – 5.8S – ITS2 rDNA region in Gieysztoria (G).
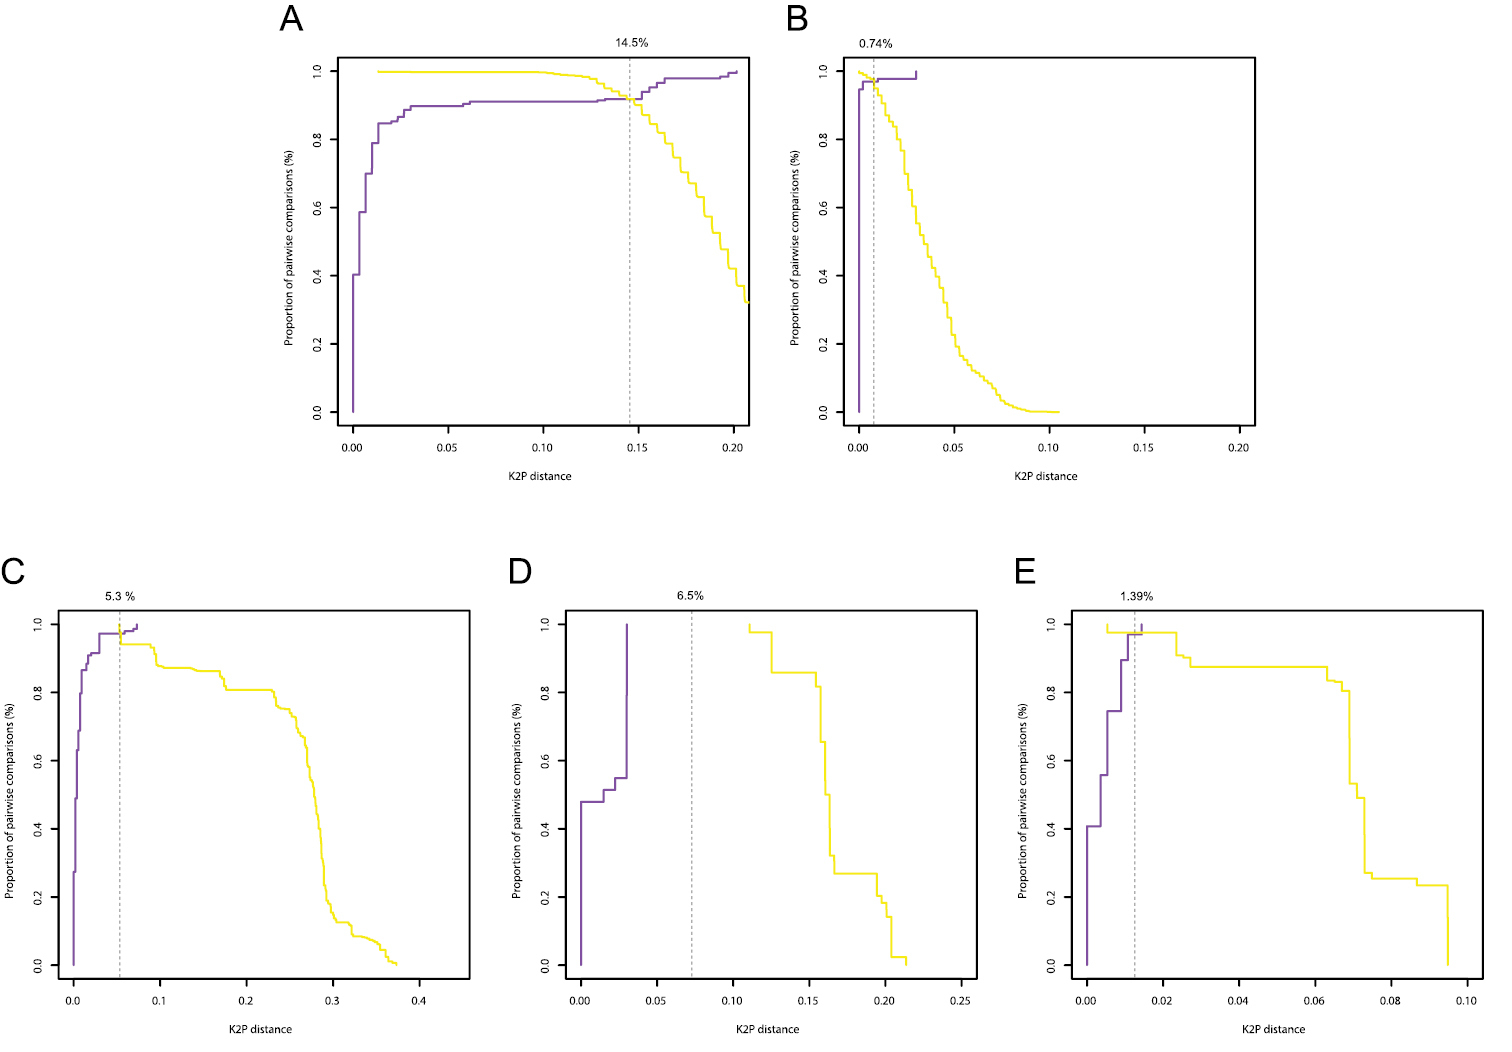
Optimum threshold defined by the intersection between the cumulative frequency distribution curves of the intraspecific (purple) and the interspecific (yellow) pairwise distances for the COI gene in Diplectanidae (A), 28S rDNA region in Diplectanidae (B), the COII gene in Gyrodactylus (C), the COI gene in Gyrodactylus (D), the ITS rDNA region in Gyrodactylus (E).
In Diplectanidae, the identification success for the 33 species was high for both COI and 28S (Table 1). In the COI dataset there was only a single incorrect identification. In the 28S dataset there were no misidentifications, but nine identifications were ambiguous because Diplectanum nanus Justine, 2007 and Diplectanum parvum Justine, 2008 share an 28S sequence despite an average COI divergence of 1.9%. In Gyrodactylus, the identification success of the eight species was 100% with all three markers.
Identification success, with best compromise threshold (BCTh) values used, as determined via the best match (BM) and best close-match (BMC) criteria.
| Dataset | Threshold (%) | Correct | Ambiguous | Incorrect | No match closer than threshold | |
|---|---|---|---|---|---|---|
| Diplectanidae COI | BM | - | 116 (99.15%) | 0 | 1 (0.85%) | - |
| BCM | 14.50% | 116 (99.15%) | 0 | 1 (0.85%) | 0 | |
| Diplectanidae 28S | BM | - | 108(92.3%) | 9 (7.69%) | 0 | - |
| BCM | 0.74% | 107 (91.45%) | 9 (7.69%) | 0 | 1 (0.85%) | |
| Gyrodactylus COII | BM | - | 38 (100%) | 0 | 0 | - |
| BCM | 5.30% | 38 (100%) | 0 | 0 | 0 | |
| Gyrodactylus COI | BM | - | 15 (100%) | 0 | 0 | - |
| BCM | 6.50% | 15 (100%) | 0 | 0 | 0 | |
| Gyrodactylus ITS | BM | - | 35 (100%) | 0 | 0 | - |
| BCM | 1.39% | 35 (100%) | 0 | 0 | 0 |
In order for COI to function as a widely used barcoding marker, ideally primers should be available allowing amplification of the gene under standard conditions for a wide range of taxa. For rhabdocoels, a taxon where the acquisition of COI data is clearly lagging behind, our results show that using universal COI barcoding primers is problematic. Universal primers seem to amplify non-rhabdocoel DNA much more efficient. This leads to contamination problems where several sequences are present in the PCR product and the resulting chromatogram becomes difficult to interpret. Problems with limited success of universal barcoding primers and with contamination by associated fauna are known from other animals as well, e.g. marine free-living nematodes (
Though less acute than in rhabdocoels, amplification success in our view is the biggest limitation to a wider use of COI barcoding in monogeneans as well. Despite the recent increase in published monogenean mitogenomes (e.g.
Our analysis of the distributions of intra- and interspecific K2P-sequence divergence shows that, in most cases, there is no clear DNA barcode gap in either COI or rDNA. However, since coalescent depths are known to vary among species, such overlap is to be expected and has indeed been reported in many other taxa (see, for example,
Our analyses of Diplectanidae and Gyrodactylus show that both rDNA and mitochondrial markers can be highly effective for species identification. It is clear that the slower evolutionary rate of the rDNA markers does not necessarily make them less suited for DNA barcoding. We therefore suggest, also for monogeneans, to continue using rDNA markers. Both the 28S and ITS region could potentially be used as barcode marker. Our analysis of Gieysztoria shows that the faster evolving ITS region does not necessarily show a more pronounced DNA barcode gap (Figure 3). The choice between both markers should therefore be based on the species that need to be identified. The 28S region can be aligned more easily between distantly related species than the ITS region. Indeed, alignment problems have been reported for ITS in several monogeneans (
Yet, the slower evolving rDNA genes might not be suited to discriminate between very recently diverged species. More conservative than ITS-1 and ITS-2, they are more suitable for deeper phylogeny reconstruction than for example the detection of cryptic species. This was evident in our analysis of Diplectanidae where Diplectanum nanus and Diplectanum parvum shared a 28S rDNA sequence while their difference amounted to a maximum of 3.2% in COI. However, in most cases, the 18S and 28S rRNA genes can also differentiate among closely related monogenean and rhabdocoel species (e.g.
Unfortunately, because rDNA has exclusively been used in a phylogenetic setting in Rhabdocoela, there is too little information about intraspecific distances to formally test its use as a barcoding marker for rhabdocoels. We suggest that further efforts to establish a DNA barcoding protocol focus on the 28S rDNA region instead of the ITS region because the overlap between intra- and interspecific distances is not smaller in the faster evolving ITS, and because the ITS region is very difficult to align, even between closely related sequences.
Given the different applicability of the various markers, we suggest the approach offered by
Walter A. Boeger (Universidade Federal do Paraná, Brazil), Thierry Backeljau, Marc De Meyer and Kurt Jordaens (Joint Experimental Molecular Unit, Royal Belgian Institute of Natural Sciences/Royal Museum for Central Africa, Belgium), Filip A.M. Volckaert (University of Leuven, Belgium) and Niels Van Steenkiste (Hasselt University, Belgium/Fisheries and Oceans Canada) are gratefully acknowledged for their input into this research. We thank Gontran Sonet (Royal Belgian Institute of Natural Sciences, Belgium) for providing some of the R-scripts and the anonymous reviewers who commented on this manuscript. T.H. was, at the time of writing, a post-doctoral fellow of the Research Foundation – Flanders (FWO-Vlaanderen). M.P.M.V. was supported by KU Leuven – VES/12/005 and by Research Programme G.0553.10 of the Research Foundation – Flanders, and is currently funded by Czech Science Foundation project no. P505/12/G112 (ECIP - Centre of excellence). This research received support from the SYNTHESYS Project (http://www.synthesys.info/) which is financed by European Community Research Infrastructure Action under the FP7 Integrating Activities Programme. Diplectanid molecular analyses were supported by the “Service de Systématique Moléculaire” of the Muséum national d’histoire naturelle (CNRS UMS 2700) and the network “Bibliothèque du Vivant” funded by the CNRS, the Muséum national d’histoire naturelle, the INRA and the CEA (Genoscope).
Supplementary table 1. (doi: 10.3897/zookeys.365.5776.app1) File format: Microsoft Excel file (xls).
Explanation note: List of clones sequenced in this study with species on which PCR was performed.
Supplementary table 2. (doi: 10.3897/zookeys.365.5776.app2) File format: Microsoft Excel file (xls).
Explanation note: Reference sequences downloaded from GenBank with accession numbers.
Supplementary table 3. (doi: 10.3897/zookeys.365.5776.app3) File format: Microsoft Excel file (xls).
Explanation note: List of species and number of sequences from each marker used in the monogenean test cases.
Supplementary table 4. (doi: 10.3897/zookeys.365.5776.app4) File format:Microsoft Excel file (xls).
Explanation note: List of species and GenBank accession numbers from the genus Gieysztoria.