


(C) 2011 Jarosław Skłodowski. This is an open access article distributed under the terms of the Creative Commons Attribution License, which permits unrestricted use, distribution, and reproduction in any medium, provided the original author and source are credited.
For reference, use of the paginated PDF or printed version of this article is recommended.
Ground beetle assemblages were studied during 2003-08 in the Pisz Forest by comparing stands disturbed by a tornado to undisturbed control stands. The following exploratory questions were put forward. (1) How do the carabid assemblages change during six years following the tornado impact? (2) Does the carabid assemblage recovery begin during the six first post-tornado years? To assess the state of carabid assemblages we used two indices: the MIB (Mean Individual Biomass) and the SPC (Sum of Progressive Characteristics). Carabid assemblages in the disturbed and in the control stands, as expressed by these two indices, were compared using the length of a regression distance (sample distance in a MIB:SPC coordinate system). A cluster analysis revealed that the assemblages of the disturbed and the control stands were different. The tornado-impacted stands produced lower carabid catch rates, but species richness was significantly higher there than in the control stands. They hosted lower proportions of individuals of European species, of large zoophages, and of forest and brachypterous species, than the control stands. The observed reduction in SPC and MIB, and an increase in the regression distances may indicate that the carabid assemblages had not started to recover from the tornado-caused disturbance. Carabid assemblages apparently responded to the tornado in two steps. Firstly, the first three years were characterized by moderate decreases of index values. Secondly, from the fourth to the sixth year after the tornado, many observed changes became magnified. We did not observe clear signals of the recovery of forest carabid assemblages during the six follow-up years.
carabid beetle, disturbance, assemblage structure, Mean Individual Biomass, Sum of Progressive Characteristics, forest fauna
Natural disturbances of ecosystems are often short term
but characterized by high amplitude. Disturbances are influential for
the dynamics of both structure and functioning of ecosystems, and are
their integral part. They vary from large scale (e.g., wildfire or
hurricane) to local ones that may concern only single or small groups of
trees (
Following a disturbance, such as a tornado impact,
forest stands (here, stand is a patch with a cluster of dominant trees
of the same origin, e.g., initiated by a clear-cutting event, and
that is surrounded by patches of other types of habitat or trees of
different origin) consist of a mosaic of patches impacted to varying
degrees, from completely destroyed trees to remnants of untouched
forest. The heterogeneity and diversity of microhabitats rapidly
increase. In these stands, patches of barren soil, directly exposed to
the drying effect of the sun and wind, may be abundant. Under such
conditions, the structure and composition of forest-floor vegetation
are obviously altered: the soil becomes drier, and the ground surface
may be covered by fallen trees and other organic material subject to
slow decomposition (
In the short term, a tornado-caused disturbance changes the functioning and structure of the forest ecosystem. The lack of canopy shelter triggers a regression process (here, a decrease in the number of species associated with closed forests and a simultaneous increase of open-area species), but the emergence of tree saplings starts at the onset of the regeneration succession. The regeneration of a disturbed ecosystem may be faster due to the mosaic-type spatial pattern. For example, under mosaic-like spatial conditions, the emergence and subsequent growth of Scots pine (Pinus sylvestris) saplings takes place through the seed pool accumulated in the soil before the disturbance and also through the seed fall from the survived trees. Similarly, stands not impacted by the disturbance may act as sources of organisms recolonizing the disturbed stands.
Carabid beetles have been extensively studied in various, disturbed forest ecosystems (e.g.,
A unique opportunity to follow disturbance-initiated
changes in forest-carabid assemblages over a long time period appeared
in July 2002, when a tornado destroyed 33, 000 hectares of Scots pine
forest in north-eastern Poland. The majority of the damaged stands were
soon cleared and planted with pine saplings. However, an untouched area
of about 445 ha (“Szast Protective Forest”) was left unmanaged. A
research project on the tornado impact started in 2003 (
The present study was done in Scots pine forests growing on podzol soils in the Pisz Forest District area, in post-tornado (disturbed stands; Szast Protective Forest) and in intact stands (control; Maskulińskie Forest District). The two study areas were located 20 km apart in order to exclude any influence of tornados in the control stands. The two study areas both hosted three replicate stands (study plots) for each of the following five age classes: 20-40 years old (class I), 40-50 (class II), 50-60 (class III), 60-80 (class IV) and >80 years old (class V). We thus had a total of 15 stands in the disturbed area (‘disturbed stands’) and 15 in the control area (‘control stands’), making up altogether 30 stands (plots).
Five pitfall traps (0.5 l glass jar with a plastic
funnel, 12 cm in diameter, containing 100 ml 70% ethylene glycol, and
covered by a 20 cm x 20 cm roof a few cm above soil surface to protect
the samples against rain and litter) were arranged 15 m apart along a
transect in each study stand. The traps were continuously operating
between early May and the end of October, and serviced every six weeks.
For each carabid individual caught, body length was measured with a
microscope and with accuracy of 0.5 mm (from the top of mandibles to the
tip of elytra) in order to calculate their biomass following
All specimens captured were identified to species level.
The collected data were pooled separately for each stand. A standardized
catch rate (individuals/day*trap) was calculated to account for
occasional trap losses. The following measures were subjected to
analysis: standardized catch rates for each species and individuals,
species richness, and the proportion of individuals belonging to
various functional groups. For the latter purpose, species were grouped
according to geographic distribution (inhabiting European or Palearctic
and Holartic regions), habitat association (forest and non forest
species), food preference (large zoophages, small zoophages and
hemizoophages) and wing morphology (brachypterous species and
macropterous species). Species richness was standardized to the lowest
number of specimens in the samples using rarefaction (
Moreover, two indices were calculated for the total catch: Mean Individual Biomass (MIB; e.g.,
SPC = 74.9 + 102 * LOG (stand age) (1)
The two values in the formula (1) are model coefficients:
74.9 for the intercept and 102 for the regression slope. SPC is the sum
of proportions of species associated with successional “old-growth”
stands over all sampled stands. These species are, in particular,
large, zoophagous, European forest carabids with autumn development (
The MIB and SPC indices can be presented in an X-Y
coordinate system to produce an SPC/MIB model that efficiently
summarizes the successional development status of species assemblages (
Prior to the statistical analyses, data were tested for
the normality of distributions and variance homogeneity using
Shapiro-Wilks and Levene’s statistics (Statistica;
The dependence of carabid recovery in time since the
tornado was tested using ANOVA with repeated measures (if normality and
variance homogeneity assumptions were fulfilled) or Mann-Whitney U test
(Statistica;
During the first six years following the tornado impact, the disturbed stands produced a total of 18, 022 individuals belonging to 82 species, while the control stands produced 19, 550 individuals representing 53 species. Altogether these made up 37, 572 specimens representing 90 species. The catch rate over all years was 0.18 individuals/trap*day in the disturbed and 0.26 individuals/trap*day in the control stands (Z = 5.29; p < 0.001). This difference was statistically significant for the years 2003-2006. During 2007-2008 the catch rate of carabids in the disturbed stands was marginally higher than in the control (Table 1).
Mann-Whitney U test for the total carabid catch rate (number of individuals/trap*day), rarefaction standardized species richness, and the proportion of individuals of different ecological, trophic and dispersal groups of carabids. Disturbed (D) and control (C) stands were compared during 2003-2008; test statistics (U), statistical significance (asterisks), and mean and SD values for D and C are shown. Significance levels: *** – p < 0.001; ** – p < 0.01; * – p < 0.05; n.s. – p > 0.05.
| 2003 | 2004 | 2005 | 2006 | 2007 | 2008 | |
|---|---|---|---|---|---|---|
| Catch rate | ||||||
| U | 1.929 * | 4.646 *** | 3.380 *** | 3.733*** | n.s. | n.s. |
| D | 0.11±0.06 | 0.06±0.02 | 0.14±0.07 | 0.15±0.06 | 0.36±0.23 | 0.28±0.12 |
| C | 0.20±0.10 | 0.25±0.06 | 0.24±0.09 | 0.29±0.09 | 0.34±0.14 | 0.22±0.06 |
| Species number | ||||||
| U | 4.314 * | 3.380 *** | n.s. | 3.443 *** | 4.646 *** | 3.899 *** |
| D | 9.05±1.79 | 6.93±1.56 | 8.65±1.66 | 11.79±2.45 | 16.43±3.89 | 13.92±3.86 |
| C | 6.31±0.87 | 8.81±1.15 | 8.72±1.15 | 8.61±0.78 | 8.51±0.92 | 9.01±1.32 |
| Forest species | ||||||
| U | 4.148*** | 3.795*** | 4.500*** | 4.646*** | 4.646*** | 4.646*** |
| D | 87.7±11.11 | 87.0±11.10 | 86.7±8.4 | 65.8±17.11 | 57.9±15.31 | 46, 3±15.43 |
| C | 98.6±2.08 | 98.7±1.61 | 97.8±1.56 | 98.5±0.91 | 99, 2±1.12 | 96, 5±4.15 |
| Eurytopic species | ||||||
| U | 2.966** | 2.903** | 4.653*** | 4.646*** | 4.646*** | 4.646*** |
| D | 7.1±8.17 | 5.9±5.33 | 8.2±5.95 | 23.4±15.78 | 34.5±13.23 | 47.7±15.94 |
| C | 1.2±1.55 | 1.1±1.58 | 0.5±0.71 | 0.5±0.64 | 0.6±0.87 | 2.5±3.95 |
| Large zoophages | ||||||
| U | 1.494* | n.s. | n.s. | 2.737*** | 2.115** | 4.272*** |
| D | 60.3±17.11 | 63.4±16.49 | 72.7±12.4 | 43.0±21.21 | 45.7±17.67 | 33.2±11.46 |
| C | 71.8±10.89 | 67.2±8.88 | 66.2±11.74 | 63.0±10.33 | 59.8±13.51 | 63.7±12.84 |
| Small zoophages | ||||||
| U | n.s. | n.s. | 3.526*** | n.s. | 3.650*** | 2.862** |
| D | 31.3±14.58 | 26.6±12.55 | 17.4±7.18 | 30.2±11.88 | 19.6±10.49 | 21.4±11.11 |
| C | 28.1±11.04 | 32.7±8.82 | 33.6±11.76 | 36.6±10.19 | 39.6±13.27 | 34.3±11.75 |
| Hemizoophages | ||||||
| U | 4.604*** | 3.899*** | 4.521*** | 4.646*** | 4.646*** | 4.646*** |
| D | 8.5±10.08 | 10.0±9.18 | 9.8±7.88 | 26.8±16.34 | 34.6±16.17 | 45.4±16.50 |
| C | 0.1±0.31 | 0.1±0.19 | 0.3±0.41 | 0.4±0.71 | 0.6±1.21 | 2.0±3.64 |
| Brachypterous species | ||||||
| U | n.s. | n.s. | n.s. | 3.816*** | 4.134*** | 4.646*** |
| D | 72.5±15.78 | 65.3±17.07 | 78.4±11.02 | 58.4±16.75 | 54.3±15.71 | 42.1±12.72 |
| C | 75.2±9.52 | 68.9±8.56 | 80.9±7.38 | 83.2±5.00 | 85.6±5.18 | 79.6±7.62 |
| Macropterous species | ||||||
| U | n.s. | n.s. | n.s. | 3.028** | 3.892*** | 4.438*** |
| D | 21.5±13.53 | 31.1±16.37 | 20.3±11.25 | 33.2±17.20 | 37.5±16.00 | 50.0±15.88 |
| C | 23.5±8.60 | 29.8±8.78 | 18.6±7.43 | 16.3±5.00 | 14.0±5.06 | 19.1±7.13 |
The mean number of carabid species was greater in the disturbed than in control stands throughout the study: 11.13 vs. 8.33 (Z = 4.60, p < 0.001). During 2004-2005, the number of species was similar in the disturbed and control stands (Table 1) but during 2006-2008), the number of species was higher in the former, the difference being most pronounced in 2007. These observations reflect the ongoing process of species turnover in the disturbed stands: forest species decline and non-forest species and/or species absent from control stands increase, such as Amara aenea, Amara commmunis, Amara equestris, Harpalus flavescens, Harpalus solitaris and Microlestes minutulus.
During the six study years, the proportion of individuals of species with European distribution gradually decreased in the disturbed stands; as a consequence, the shares of Palaearctic and Holarctic species increased there (Fig. 1). Considering the entire six-years period, the average share of species with European distribution was 35.2% in the disturbed and 58.8% in the control stands (LSD test, p < 0.001). The difference in the proportion of individuals of European species between disturbed and control stands increased from 5.0% (55.8% vs. 50.8%) in 2003 to 45.3% (70.9% vs. 25.6%) in 2007 (Fig. 1).

The proportion of individuals of European carabid species living in tornado-impacted and in control stands during 2003-2008.
The dominance structure of carabids changed from 2003 to 2008. In the disturbed stands in 2003, the Palaearctic Carabus arvensis (28.2%) was nearly equally abundant as the European Carabus violaceus (24.8%). However, in 2007, the Palaearctic Carabus arvensis and Amara lunicollis dominated, altogether making up 62.1% of the total catch in the disturbed stands, and 15.1% in the control stands.
During the six years of study, the proportion of individuals of forest carabids was on average 26.3% lower in disturbed than in control stands (71.9% vs. 98.2; Z = 10.74; p < 0.001). Until 2005, individuals of forest species were 87.7%-86.7% in the disturbed stands and 97.8%-98.7% in the control stands. Since 2006, the proportion of individuals of forest carabids in the disturbed stands decreased, reaching an all-time low of 46.3% in 2008. In the control stands for the same period, the proportion consistently remained around 96.5 % (Table 1). These differences can be seen at the species level too. In the disturbed stands, the dominant species during 2003-2008 was the forest dweller Carabus arvensis (up to 43.9 ± 15.1 % of the total catch in the disturbed and 26.1 ± 11.50 in the control stands). Simultaneously, the proportion of many other forest species gradually decreased: Carabus hortensis, Carabus violaceus and Pterostichus oblongopunctatus (Appendix A).
In the disturbed stands, forest species decreased and eurytopic species increased during the six study years. Eurytopic carabid individuals made up on average 21.1% of the catch in the disturbed and 1.1 % in the control stands (Z = 10.08; p < 0.001). During the first three years following the tornado, the proportion of individuals of eurytopic species in the disturbed stands varied between 5.9% and 8.2%; however, since the fourth year (2006), the proportion increased to, on average, 47.7% in 2008 (Table 1). The increase of eurytopic carabid individuals in successive years was significant (from 2005 to 2008; Z = 2.16 to 3.23, p = 0.028 to 0.001). Eurytopic species that dominated in the disturbed stands included Amara lunicollis (6.6%-36.7%), Calathus erratus (2.8%-4.8%) and Harpalus rufipalpis (3.3%-5.0%; Appendix B). Open-area species could also be found in the disturbed stands at a rather constant proportion of 5.1%-10.8%.
Considering the entire period of study, the proportion of individuals belonging to large zoophages in the disturbed stands was, on average, 12.2% lower than that in control stands (53.1% vs. 65.3%; Z = 3.93; p < 0.001). However, in 2004 and 2005 (second and third year after the tornado), the difference was not significant (Table 1). In the control stands in 2003-2005, large species dominated: Carabus arvensis (20.0%-24.9%), Pterostichus niger (20.3%-24.7%), Carabus violaceus (10.6%-16.8%) and Carabus coriaceus (5.4%-8.3%). In the disturbed stands, on the other hand, Carabus arvensis was the most numerous species (24.4-43.9% of the total catch), Carabus violaceus contributed 19.6%-25.4%, and Pterostichus niger made up 6.4%-7.7% there. During 2006-2008, the proportion of large zoophages was 14.0%-30.4% lower in disturbed than in control stands. During the six years of study, also the proportion of individuals of small zoophages decreased in the disturbed stands from 31.3% to 21.4% but increased in the control stands from 28.1% to 34.3% (Table 1).
The decreasing proportion of individuals of either large or small zoophages in the disturbed stands was accompanied by an increase of the hemizoophages; their proportion was on average higher in disturbed than in control stands (22.5% vs. 0.6%; Z = 10.84, p < 0.001). The disturbed stands had apparently been subject to colonization by hemizoophages since the first year after the tornado (2003), but the proportion of their individuals started to significantly increase in the fourth year after the tornado (2006). In the year 2008, individuals of hemizoophages contributed > 45% of all individuals in the disturbed stands (Table 1). The most frequent hemizoophage caught in disturbed stands was Amara lunicollis that dominated the catch in 2008 (36.7%), replacing Carabus arvensis (17.2%) as the most abundant species there (Appendix B).
During 2003-2008, the average proportion of individuals of the brachypterous species in the control stands was 78.9%, while in the disturbed stands it was 61.8% (Z = 6.14, p < 0.001). During the first three years of study (2003-2005), the difference in proportion of individuals of wingless carabids between disturbed and control stands was non-significant (Table 1). Since 2006, the proportion of individuals of brachypterous species decreased in the disturbed stands from 58.5% to 42.1%, and the difference between disturbed and control stands was 37.5% in 2008 (42.1% vs. 79.6%; Table 1). Wingless species decreased and macropterous species increases in the disturbed stands. Over the whole study period, the individuals of macropterous species made up 32.3% in the disturbed and 20.2% in the control stands (Z = 4.56, p < 0.001). The increase in the proportion of macropterous species in the disturbed stands apparently started in 2006, when the macropterous Amara lunicollis started to become abundant (Appendix B). Individuals of wing-dimorphic species became slightly more abundant in the disturbed stands, but never reached 10% during the study years (averages 5.9% for disturbed and0.9% for control stands; Z = 7.10, p < 0.001).
A cluster analysis (Fig. 2) for the carabid data similarity indicated faunal differences between disturbed and control stands, indicated by two stand clusters already in the first year after the tornado (2003). The analysis also lumped the oldest disturbed stand into the cluster of control stands. In the subsequent years, the carabid assemblages of the disturbed and control stands were distinctive, with decreasing similarity. Fig. 2 shows similarity diagrams for 2003 and 2008. These observations were somewhat supported by the indices: the Renkonen index for the similarity between disturbed and control stands was 64.4% in 2003 and 45.8% in 2008 (Table 3).
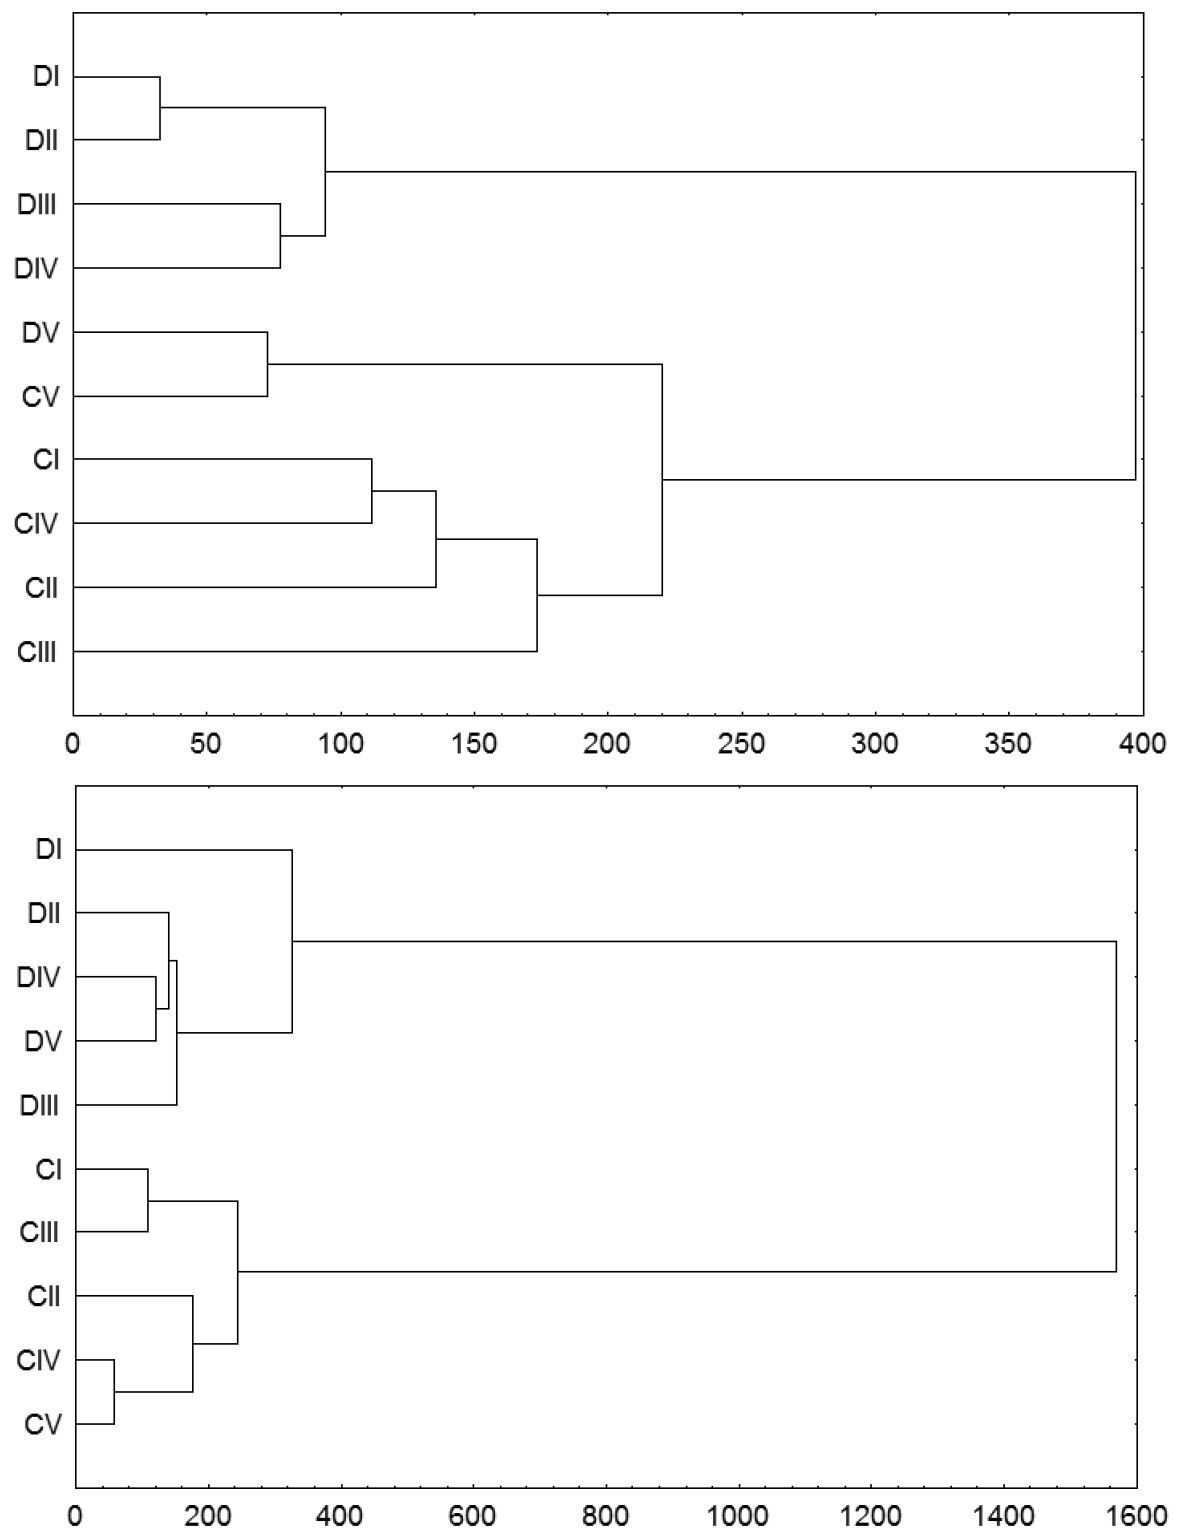
Dendrograms of species similarity of carabid beetle assemblages inhabiting tornado-impacted (D) and control stands (C) in age classes I–V (see text) in the first (2003) and last (2008) years of observation. The analysis was performed with the Ward method and Euclidean distance as the measure of similarity.
The response of carabid assemblages to the tornado disturbance could also be demonstrated using MIB and SPC indices and the regression distances retrieved from a SPC/MIB model (see Material and methods). The mean MIB during the six years of study was 214.3 mg for the disturbed and 303.0 mg for the control stands (LSD test; p < 0.001; Table 2).
Repeated-measures ANOVA for the proportion of individuals of European species, for MIB and SPC indices, and for the regression distances describing the carabid assemblage of stands disturbed by the 2002 tornado, and in intact control stands. Factors: Stand (disturbed vs control stands), Age (stand age class I-V), and Time (2003–2008). LSD post hoc test explanation: 1-3 (2003-2004), 4-6 (2005-2006), D (disturbed stands), C (control stands), I-V (age class). Significance levels: *** – p < 0.001; ** – p < 0.01; * – p < 0.05; n.s. – p > 0.05).
| Effect | SS | df | MS | F | P | Post-hoc test |
|---|---|---|---|---|---|---|
| European sp. | ||||||
| Time | 3422.2 | 5 | 684.4 | 7.82 | <0.001 | 1-3 > 4-6** |
| Time*Stand | 8879.0 | 5 | 1775.8 | 20.28 | <0.001 | D < C*** |
| Time*Age | 1576.4 | 20 | 78.8 | 0.90 | n.s. | |
| Time*Stand*Age | 1634.2 | 20 | 81.7 | 0.93 | n.s. | |
| Error | 8754.9 | 100 | 87.5 | |||
| MIB | ||||||
| Time | 694244.8 | 5 | 138849.0 | 48.03 | <0.001 | 1-3 > 4-6*** |
| Time*Stand | 65289.1 | 5 | 13057.8 | 4.52 | <0.001 | D < C*** |
| Time*Age | 105863.3 | 20 | 5293.2 | 1.83 | 0.0269 | I-III < IV-V** |
| Time*Stand*Age | 56179.9 | 20 | 2809.0 | 0.97 | n.s. | |
| Error | 289092.1 | 100 | 2890.9 | |||
| SPC | ||||||
| Time | 69415.4 | 2 | 13883.1 | 20.60 | <0.001 | 1-3 > 4-6*** |
| Time*Stand | 92119.1 | 2 | 18423.8 | 27.33 | <0.001 | D < C*** |
| Time*Age | 10586.2 | 20 | 529.3 | 0.79 | n.s. | |
| Time*Stand*Age | 11353.2 | 20 | 567.7 | 0.84 | n.s. | |
| Error | 67402.1 | 100 | 674.0 | 0.84 | ||
| Regressive distance | ||||||
| Time | 200832 | 5 | 40166 | 14.24 | <0.001 | 1-3 < 4-6*** |
| Time*Age | 45559 | 20 | 2278 | 0.81 | n.s. | |
| Error | 141080 | 50 | 2822 | |||
Sørensen index for compositional similarity and Renkonen index for dominance structure for carabid assemblages inhabiting tornado-disturbed and intact control stands during 2003–2008 (% units).
| Index | 2003 | 2004 | 2005 | 2006 | 2007 | 2008 |
|---|---|---|---|---|---|---|
| Sørensen | 58.46 | 55.17 | 68.97 | 67.44 | 65.91 | 65.17 |
| Renkonen | 64.43 | 68.00 | 55.37 | 45.78 | 36.19 | 45.80 |
During the first three years after the tornado (2003-2005), a relatively small decrease of about 20.2 mg in MIB was observed in the disturbed stands (from 306.7 mg to 286.5 mg) and about 55.1 mg in the control stands (from 388.0 mg to 332.9 mg; Fig. 3). In 2006, MIB was 134.0 mg lower in disturbed than in control stands (149.4 mg vs. 283.4 mg; LSD test, p < 0.001). The largest difference in MIB between disturbed and control stands was in 2008 (121.1 mg vs. 260.8 mg; LSD test, p < 0.001; Fig. 3).
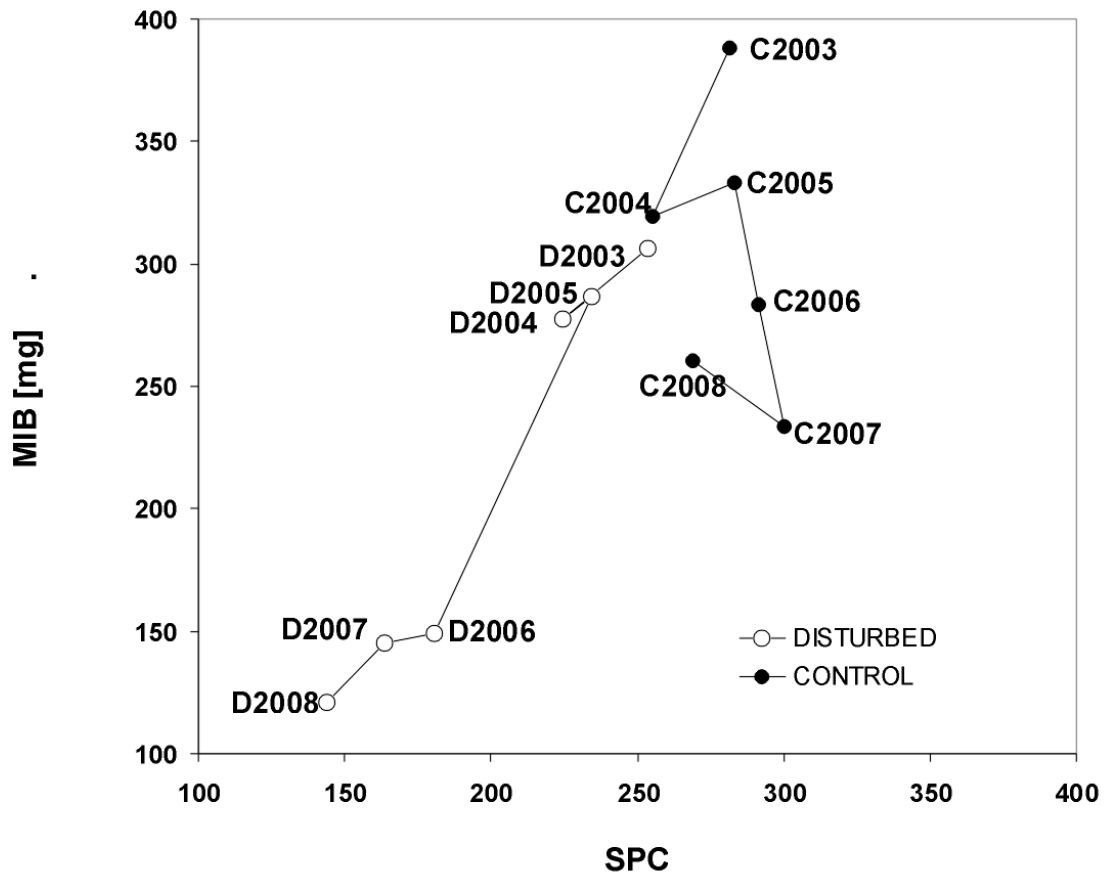
The MIB/SPC model of carabid assemblages living in tornado-impacted (D) and control stands (C) during 2003-2008.
Considering the entire study period, the SPC values were on average 200.0 in the disturbed and 280.0 in the control stands (LSD test, p < 0.001; Table 2). In 2006, the difference in SPC between disturbed and control stands was 111.1 units (180.5 vs. 291.5; LSD test, p < 0.001). The highest difference was 128.8 units in 2008 (268.8 vs. 144.0; LSD test, p < 0.001). Both ANOVA and LSD test confirmed the reduction of MIB and SPC in the disturbed stands, compared with the control stands (Table 2).
In the first year after the tornado (2003), the mean regression distance of carabid assemblages between disturbed and control stands was 79.0 ± 47.9 (Fig. 4). In 2004 and in 2005, the regression distances were 61.8 ± 44.0 and 66.2 ± 35.4, respectively. The regression distance peaked in 2006, being 174.8 ± 28.1 (LSD test, p < 0.001), and remained high until 2008 (188.1 ± 29.4).
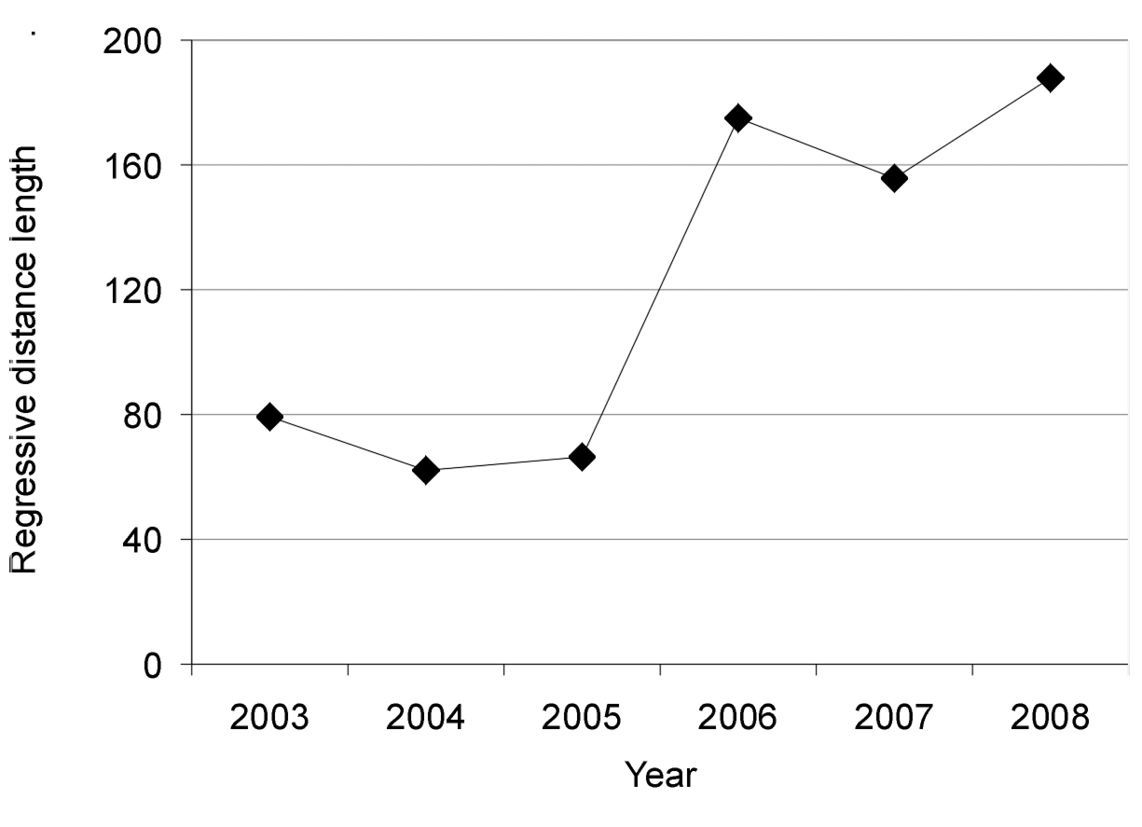
Regression distances between carabid assemblages inhabiting post-tornado (disturbed) and control stands during 2003-2008.
The environment under study had been subject to a major
disturbance that severely affected carabid assemblages in the impacted
stands: a tornado. During the first few years after the disturbance,
soil weight humidity was 1.6% lower in the disturbed than in the control
stands; moreover, soil nitrogen concentration was higher, and the
lack of tree crowns that usually acidify the rain water may have led to
an increase in the soil pH (
During the entire six-years period following the tornado
impact, carabid richness was 33% higher in disturbed than in control
stands (Table 1). This finding is in agreement with several studies done in tornado-impacted stands (
Generally, carabid species richness is positively influenced by disturbances in forest ecosystems, such as wildfire (e.g.,
The decrease in epigeic carabid catch rates can be related with the development of forest floor vegetation (
Another explanation could be the fact that the decline of forest species in the disturbed stands was not accompanied by the appearance of non-forest species during the first three years after the tornado. The disturbed stands started to be colonized by eurytopic and open-area species (particularly by Amara lunicollis) as late as in 2006, which resulted in an increase in the total catch rate. Yet another explanation might be obtained from weather conditions. Many indices peaked in 2006. Over the entire period of study, that year was characterized by cold winter air temperature (-32, 2ºC near the ground) and high summer temperature (maximum air temperature +32, 6ºC) accompanied by the lack of precipitation (data from the Hydrologic-Meteorological Station of Olsztyn; Biuletyn Państwowej Służby Hydrologiczno-Meteorologicznej IMiGW).
During 2007-2008, carabids with an European range, including western Siberia, decreased (Fig. 1). Similar changes have previously been associated with other disturbances, such as clear-cutting and wildfire (
The delayed tornado response of three years by carabids
was most clearly seen in the decreasing catches of both large and small
zoophages and an accompanying, up to 45.5%, increase in the share of
hemizoophages (Table 1).
At the beginning of the present study, large zoophages dominated the
carabid assemblages in both the tornado-impacted and the control stands ,
but since 2006 the impacted stands became dominated by hemizoophages,
particularly Amara lunicollis.
In the tornado-impacted stands, brachypterous species
declined while macropterous species associated with arid, sunny,
grassy habitats increased (
The species composition of tornado-impacted stands was
different in impacted and in control stands. Similar decreases in
species similarity in carabid assemblages between post-tornado and
control stands have been reported by
The effect of the tornado on forest carabids was best illustrated by the MIB and SPC indices (Fig. 3).
The decrease in MIB in the control stands throughout the study may have
resulted from an increasing proportion of the small zoophage Calathus micropterus and proportional decreases of the larger Carabus arvensis and Carabus violaceus.
The pattern was different in the disturbed stands where both indices
used for the construction of the SPC/MIB model had been continuously
decreasing, visualized by their gradual movement towards the
bottom-and-left-hand corner in Fig. 3.
Such a pattern suggests an enhanced regression (changes in structure
and functioning of assemblages from higher to lower levels of succession
development) of carabid assemblages and their habitat after disturbance
(
The most important change in the carabid assemblages of
tornado-disturbed stands was the change toward a species composition
typical for early-successional, regenerating forests: carabids
associated with late-successional forests were partly replaced by
eurytopic and pioneer species characteristic of early successional
phases. The chronology of the observed successional changes is
particularly interesting. The most drastic change in the carabid fauna
takes place during the first three years following a disturbance (
This six-year study demonstrated a long-lasting down-turn of the forest carabid assemblage, suggesting a substantial change in this environment. Field data collected in the seventh year after the tornado impact, that is 2009, are subject to analyses. Even though these data have been only preliminarily elaborated so far, it seems that the carabid communities have eventually started to recover. Among other signals of recovery, forest species seem to increase in abundance, and the values of MIB and SPC are also increasing, and the regression distance between disturbed and control stands has decreased. Following the emergence of new, naturally regenerated seedling trees (apart from 2-3 years old pine and birch) one can expect that the subsequent years will be characteristic of both the recovery of forest-carabid fauna, and the recovery of the entire ecosystem. It is noteworthy that in the Pisz Forest the trees that survived are not threatened by under-the-bark pests, due to the fact that the hurricane disturbance of the forest had taken place in the month of July, thus disrupting the main season of these pests� flight and the period of egg lying, a yearly spring event. Moreover, in the subsequent years, the injured trees became dry and did not attract dead-wood dependent insects any more. Therefore, a reasonable suggestion is to retain some fallen trees in the tornado-impacted stands and wait for the spontaneous natural regeneration of the forest ecosystem.
The first author would like to thank the Ministry of High Education for financial support: grants: 2P06L 026 26 (in years: 2004-2006) and N N309 294934 (in years: 2008-2010). We would like to thank Matti Koivula for his friendly and great help in improving the manuscript.
The most abundant carabid species and their participation in communities inhabiting disturbed stands and controls stands during observations performed in years: 2003-2008.
| Control | Disturbed | ||
| 2003 | |||
| Carabus arvensis | 24.4 ± 15.1% | Pterostichus niger | 24.7 ± 12.4% |
| Carabus violaceus | 25.4 ± 15.2% | Carabus arvensis | 20.0 ± 11.6% |
| Pterostichus oblongopunctatus | 12.4 ± 9.5% | Pterostichus oblongopunctatus | 23.3 ± 8.8% |
| Calathus micropterus | 11.9 ± 8.8 % | Carabus violaceus | 16.8 ± 10.1% |
| Pterostichus niger | 7.7 ± 5.5% | Carabus coriaceus | 7.1 ± 5.2% |
| 2004 | |||
| Carabus arvensis | 31.7 ± 15.8% | Pterostichus oblongopunctatus | 29.6 ± 8.7% |
| Pterostichus oblongopunctatus | 19.6 ± 12.3% | Carabus arvensis | 24.9 ± 12.8% |
| Carabus violaceus | 19.5 ± 12.4% | Pterostichus niger | 20.3 ± 8.5% |
| Pterostichus niger | 6.8 ± 5.1% | Carabus violaceus | 12.2 ± 6.5% |
| Carabus coriaceus | 5.4 ± 3.3% | ||
| 2005 | |||
| Carabus arvensis | 43.9 ± 15.1% | Carabus arvensis | 22.3 ± 9.0% |
| Carabus violaceus | 20.5 ± 11.1% | Pterostichus niger | 21.8 ± 7.9% |
| Pterostichus niger | 6.4 ± 4.6% | Calathus micropterus | 14.5 ± 13.0% |
| Pterostichus oblongopunctatus | 7.6 ± 5.4% | Pterostichus oblongopunctatus | 16.8 ± 7.0% |
| Amara lunicollis | 6.6 ± 5.8% | Carabus violaceus | 10.6 ± 5.4% |
| Calathus micropterus | 5.7 ± 3.9% | Carabus coriaceus | 8.3 ± 4.2% |
| 2006 | |||
| Carabus arvensis | 31.7 ± 23.9% | Pterostichus niger | 27.3 ± 9.4% |
| Calathus micropterus | 15.2 ± 11.6% | Calathus micropterus | 22.2 ± 10.1% |
| Amara lunicollis | 12.7 ± 12.2% | Carabus arvensis | 17.4 ± 6.5 % |
| Carabus violaceus | 7.1 ± 5.0% | Pterostichus oblongopunctatus | 14.4 ± 4.3% |
| Carabus violaceus | 8.6 ± 3.0% | ||
| 2007 | |||
| Carabus arvensis | 31.4 ± 22.2% | Pterostichus niger | 30.5 ± 12.4% |
| Amara lunicollis | 22.9 ± 14.3% | Calathus micropterus | 25.5 ± 12.1% |
| Calathus micropterus | 8.4 ± 3.7% | Carabus arvensis | 15.1 ± 6.7% |
| Pterostichus niger | 9.1 ± 7.4% | Pterostichus oblongopunctatus | 13.2 ± 4.8% |
| Harpalus rufipalpis | 5.0 ± 3.3% | Carabus violaceus | 7.8 ± 4.1% |
| 2008 | |||
| Amara lunicollis | 36.7 ± 18.7% | Carabus arvensis | 26.1 ± 11.5% |
| Carabus arvensis | 17.2 ± 11.0% | Pterostichus niger | 20.2 ± 10.0% |
| Calathus micropterus | 8.7 ± 5.7% | Pterostichus oblongopunctatus | 16.4 ± 6.4% |
| Pterostichus niger | 10.4 ± 8.1% | Calathus micropterus | 15.0 ± 9.3% |
| Carabus violaceus | 5.1 ± 3.8% | Carabus violaceus | 11.8 ± 3.4% |
The changes of dominance indices of some of the most abundant carabid species inhabiting disturbed stands D and controls stands C.
| Species | Stand type | 2003 | 2004 | 2005 | 2006 | 2007 | 2008 |
|---|---|---|---|---|---|---|---|
| Amara lunicollis (Schiodte 1837) | D | 1.15 | 2.57 | 6.63 | 12.66 | 22.92 | 36.69 |
| C | 0 | 0.04 | 0.06 | 0.19 | 0.28 | 1.2 | |
| Calathus erratus (C.R. Sahlberg 1827) | D | 3.07 | 1.09 | 0.31 | 3.29 | 3.79 | 5.1 |
| C | 0.29 | 0.2 | 0.18 | 0.09 | 0.06 | 0.52 | |
| Calathus micropterus (Duftschmid 1812) | D | 11.95 | 2.96 | 5.8 | 15.21 | 8.38 | 8.79 |
| C | 2.89 | 2.28 | 14.52 | 22.28 | 25.49 | 15.01 | |
| Carabus arvensis Herbst 1784 | D | 24.36 | 31.68 | 43.89 | 31.68 | 31.44 | 17.15 |
| C | 19.99 | 24.94 | 22.32 | 17.39 | 15.11 | 26.14 | |
| Carabus coriaceus (Linnaeus 1758) | D | 0 | 0 | 0 | 0 | 0 | 0.01 |
| C | 7.13 | 5.39 | 8.38 | 4.93 | 2.88 | 2.74 | |
| Carabus hortensis Linnaeus 1758 | D | 1.09 | 1.54 | 0.81 | 0.17 | 0.26 | 0.14 |
| C | 0.73 | 1.12 | 0.86 | 0.85 | 0.81 | 0.51 | |
| Carabus violaceus Linnaeus 1758 | D | 25.37 | 19.56 | 20.48 | 7.06 | 4.45 | 5.14 |
| C | 16.79 | 12.2 | 10.66 | 8.6 | 7.89 | 11.75 | |
| Harpalus rufipalpis Sturm 1818 | D | 0.31 | 0.33 | 0.41 | 3.44 | 4.96 | 3.22 |
| C | 0 | 0 | 0 | 0.02 | 0.02 | 0 | |
| Pseudoophonus rufipes (Degeer 1774) | D | 0.85 | 0.6 | 1.34 | 3.81 | 3.92 | 1.74 |
| C | 0 | 0 | 0 | 0.01 | 0.02 | 0.02 | |
| Pterostichus niger (Schaller 1783) | D | 7.71 | 6.84 | 6.41 | 3.64 | 9.11 | 10.38 |
| C | 24.67 | 20.32 | 21.8 | 27.31 | 30.53 | 20.2 | |
| Pterostichus oblongopunctatus (Fabricius 1787) | D | 12.41 | 19.61 | 7.63 | 4.28 | 1.69 | 1.89 |
| C | 23.34 | 29.65 | 16.84 | 14.38 | 13.25 | 16.39 |