|
||
|
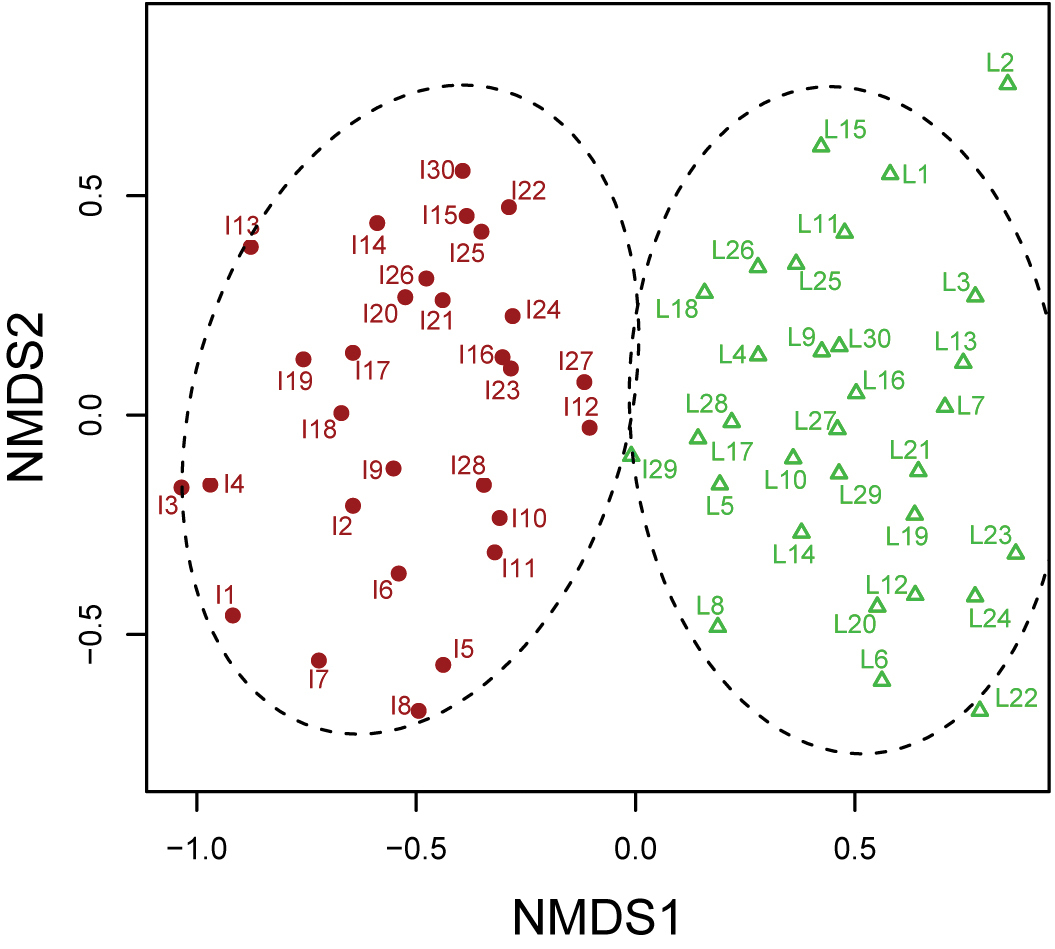
Non-metric multidimensional scaling ordination of each plot of the island and lakeshore sites. From I1 to I30: plots at the island site; from L1 to L30: plots at the lakeshore site. The differences of color and symbol represent the result of clustering. |