|
||
|
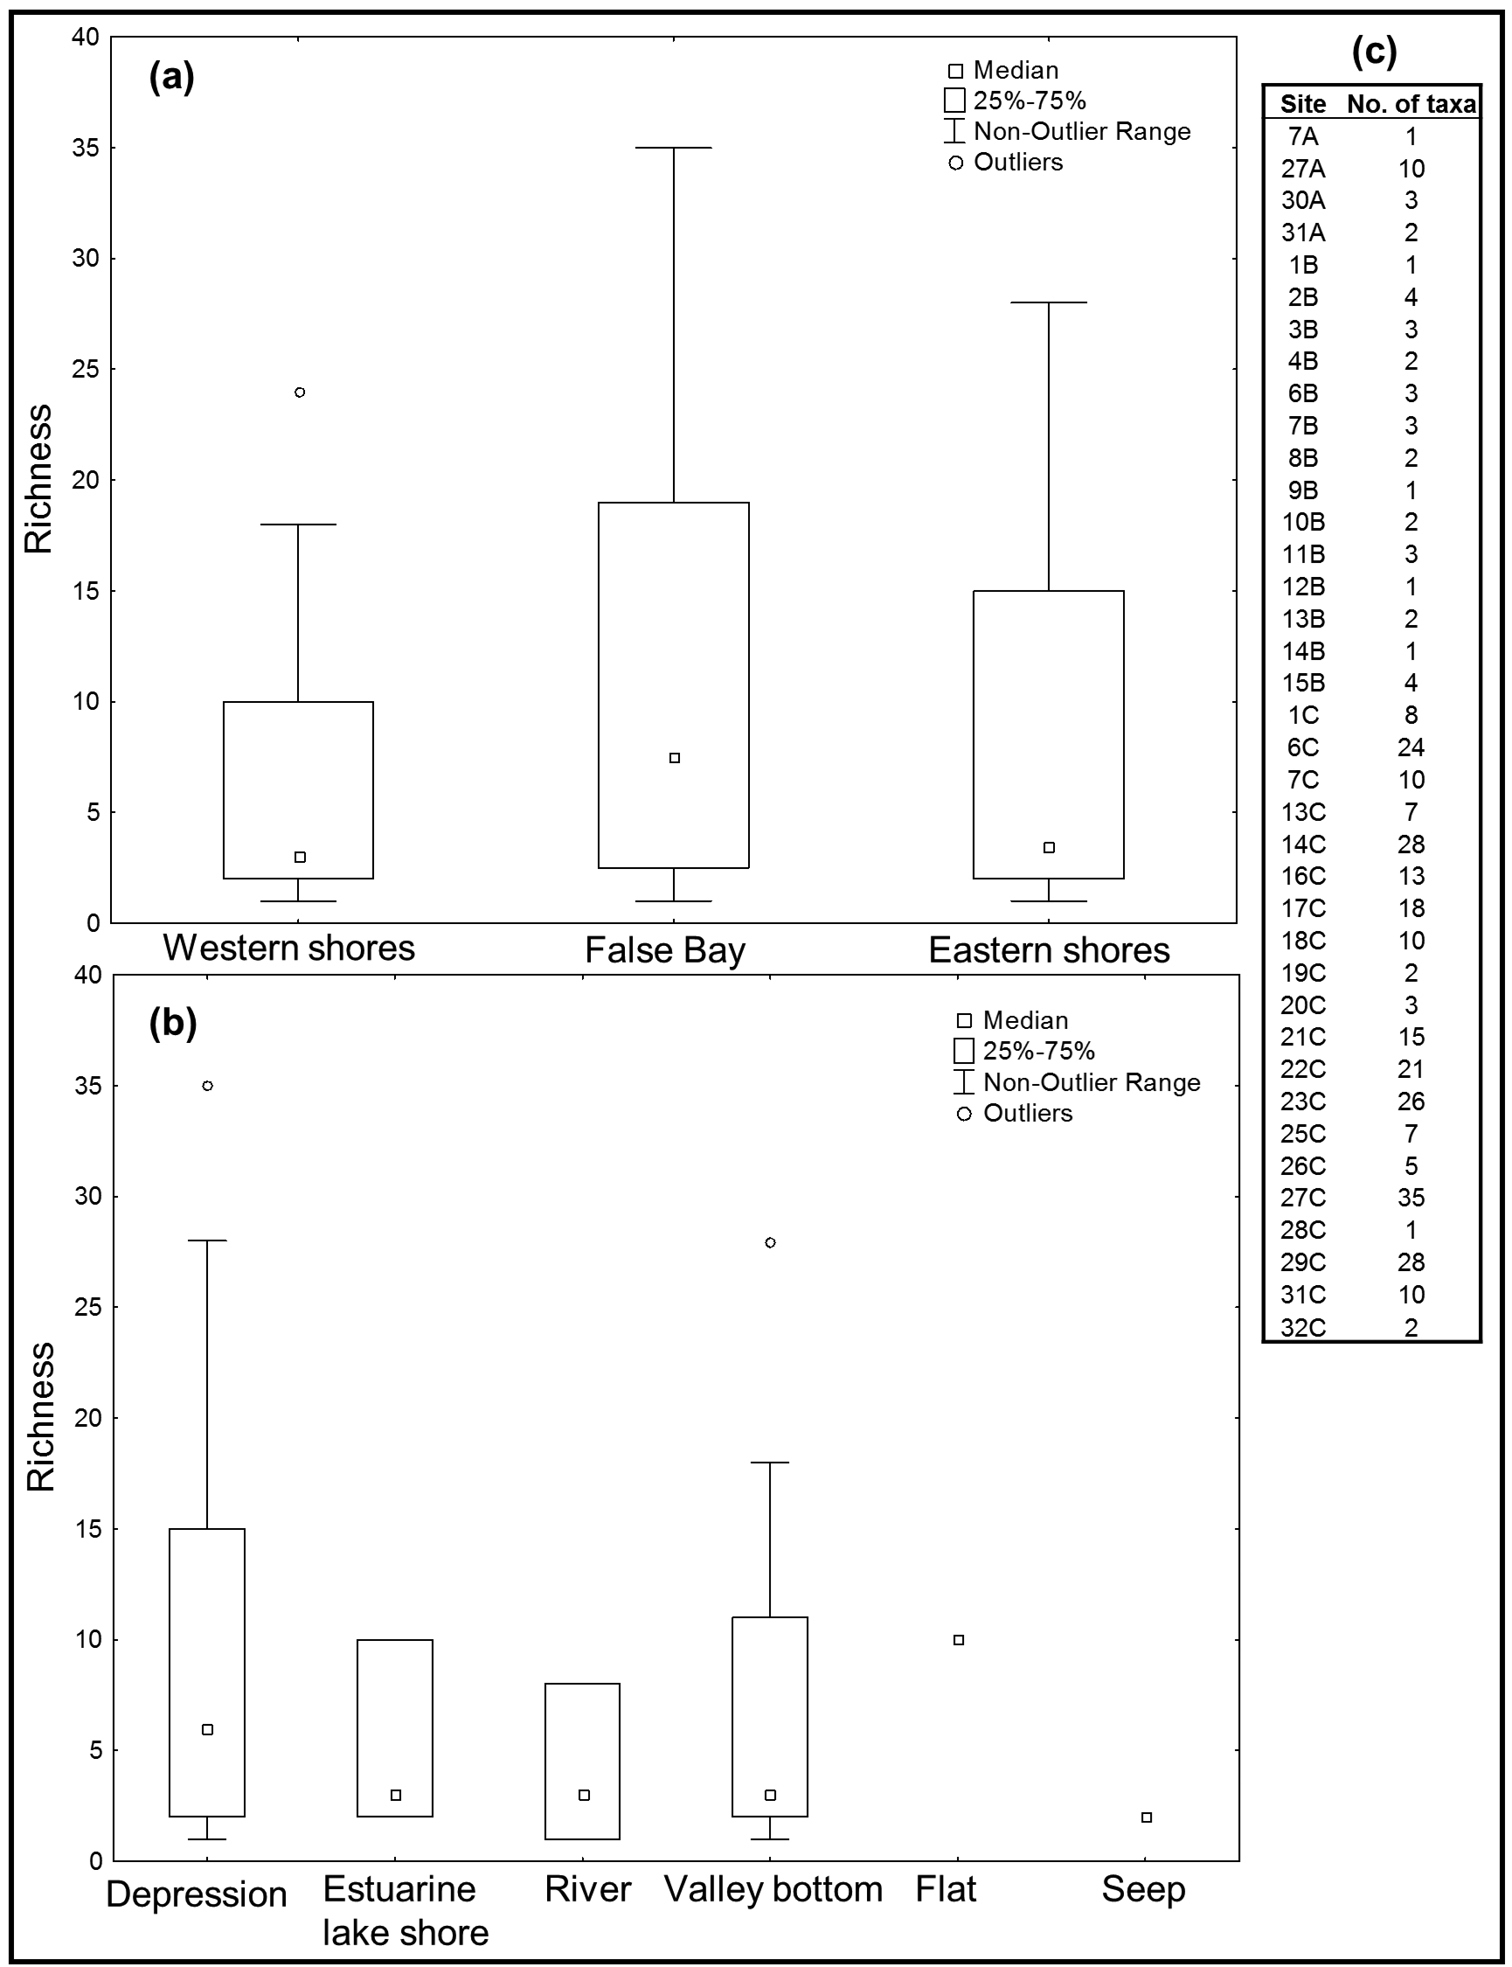
Box-plots comparing the median and spread of species richness (number of hydradephagan taxa per site) among a regions and b waterbody types at St Lucia during the sampling period 2013–2015. The data representing number of taxa per site are also reported (c). Site numbers in (c) are coded as A (first survey – November 2013), B (second survey – July 2014) or C (third survey – January/February 2015). Kruskal-Wallis tests indicated that species richness did not vary significantly among regions (KW-H2, 38 = 1.0025, p = 0.6058) or waterbody types (KW-H5, 38 = 2.273, p = 0.8102). |