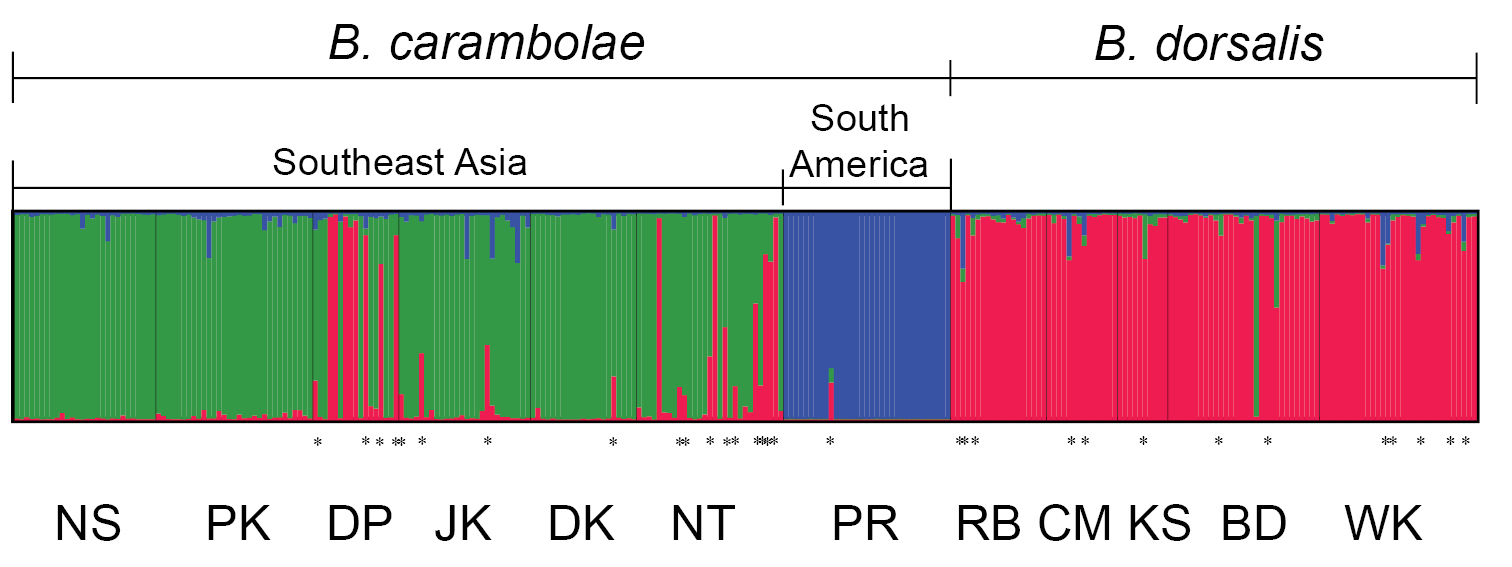
The individual admixture plot for K = 3. Each bar reveals a single individual. Each color of bars represents each genetic cluster. Samples of B. carambolae belong to clusters 2 and 3 (green and blue, respectively) while samples of B. dorsalis belong to cluster 1 (red). Potential hybrids have a proportion of genetic cluster (Q) between 0.100 to 0.900 (0.100 ≤ Q ≤ 0.900) as identified with asterisk (*).


  Part of: Aketarawong N, Isasawin S, Sojikul P, Thanaphum S (2015) Gene flow and genetic structure of Bactrocera carambolae (Diptera, Tephritidae) among geographical differences and sister species, B. dorsalis, inferred from microsatellite DNA data. In: De Meyer M, Clarke AR, Vera MT, Hendrichs J (Eds) Resolution of Cryptic Species Complexes of Tephritid Pests to Enhance SIT Application and Facilitate International Trade. ZooKeys 540: 239-272. https://doi.org/10.3897/zookeys.540.10058