|
||
|
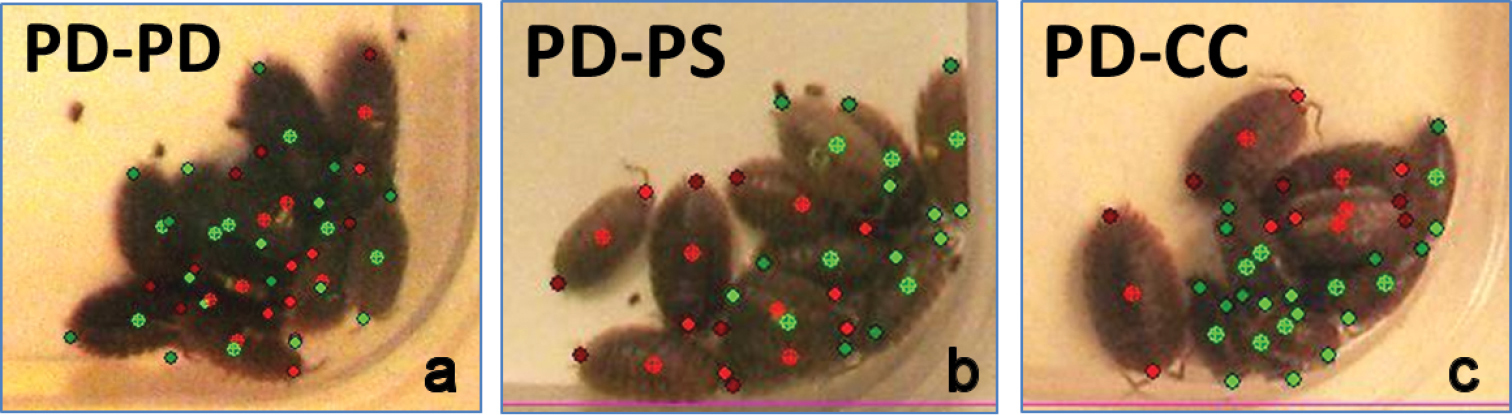
Aggregation heterogeneity in woodlice. Aggregation patterns of two groups of woodlice illustrating the Aggregation Heterogenity Index (AHI) and the Spatial Mixed Index (SMI). PD: P. dilatatus, PS: P. scaber, CC: C. convexus. Values of indexes: PD-PD: AHI=0.93 & SMI=0.80; PD-PS: AHI=0.67 & SMI=0.60; PD-CC: AHI=0.63 & SMI=0.33. |