|
||
|
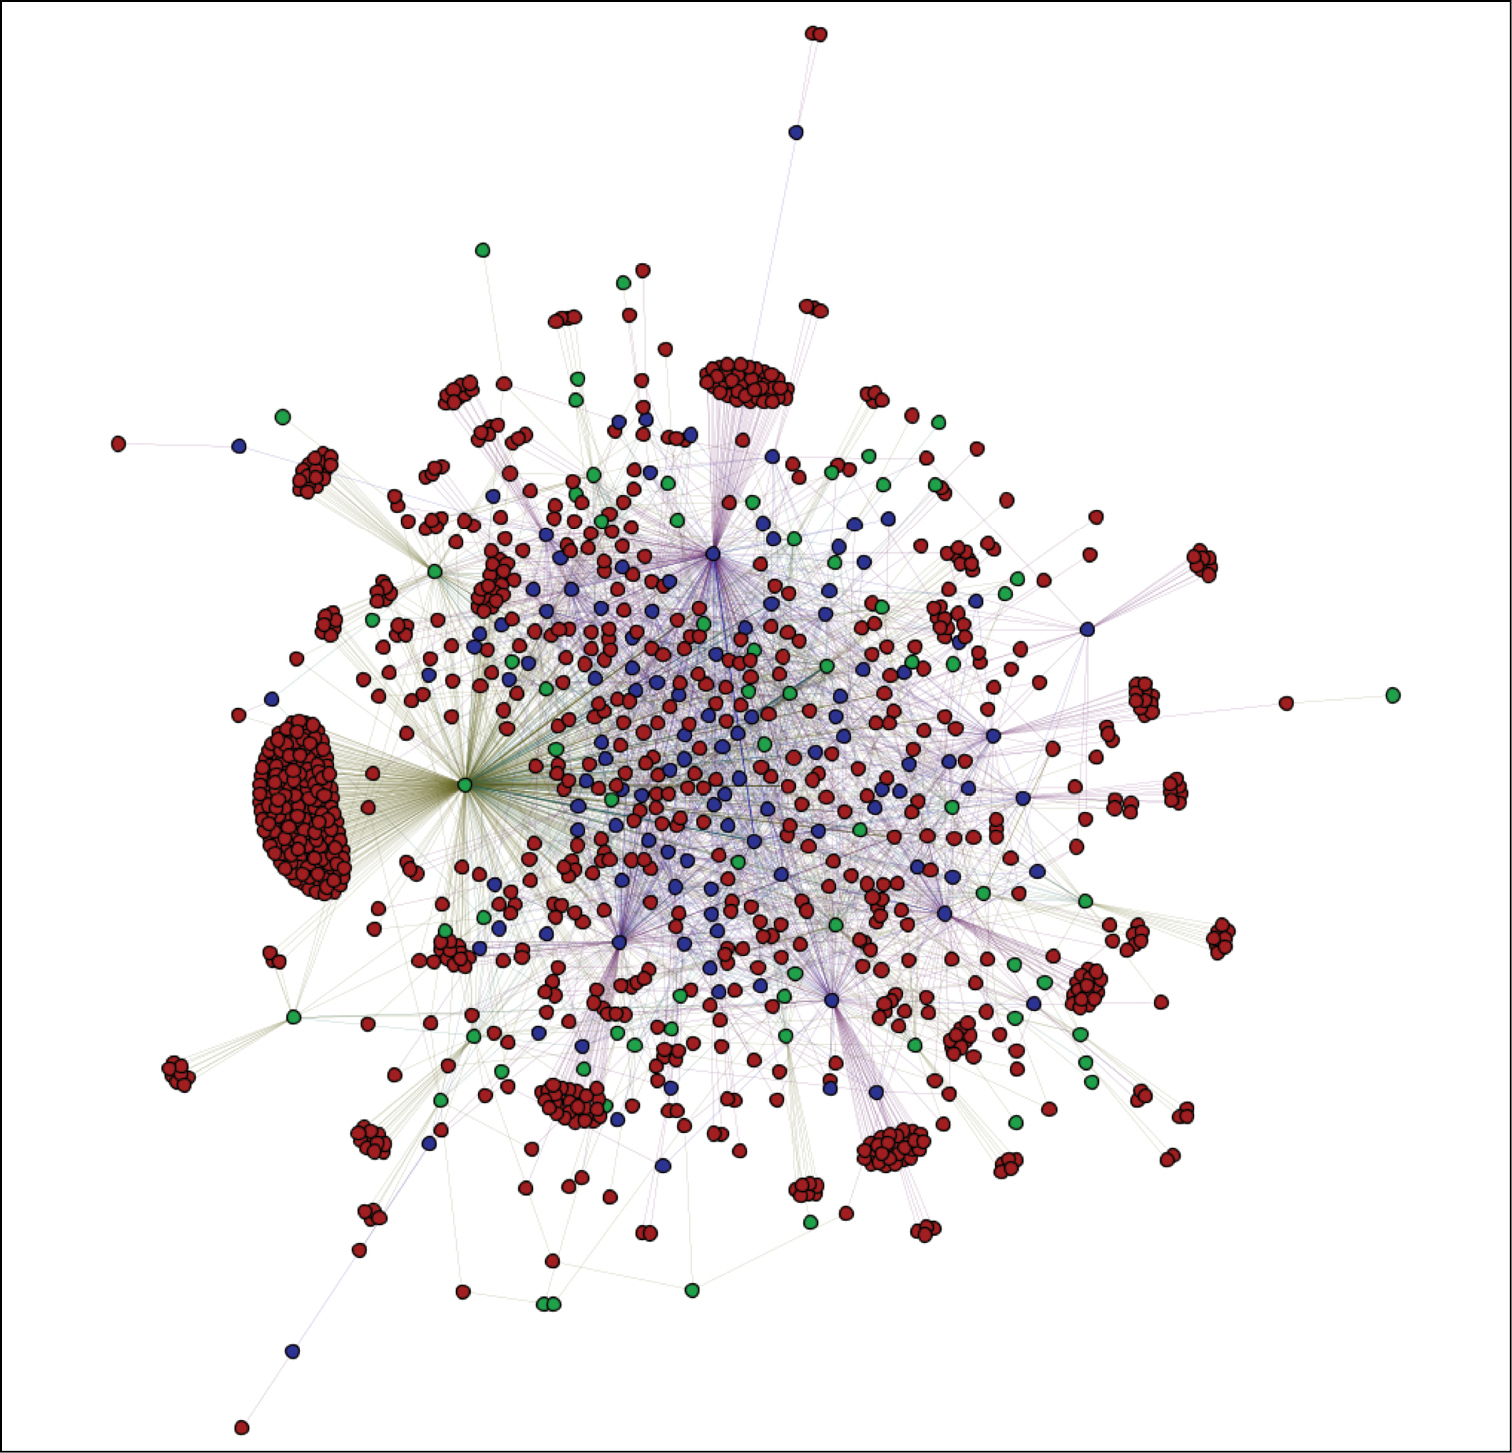
The network linking participants who posted observations to iSpotnature.org without an identification and those providing a likely identification for those observations. The diagram is based on the sample of 5,000 identifications made up until 1 July 2014. This activity occurred over 32 days. The network contains 1,110 nodes linked by 2,876 edges. Red nodes (83.23%) are participants who only received identifications, green nodes (6.38%) are participants who only made identifications and blue nodes (10.39%) are participants who both made and received identifications. |