|
||
|
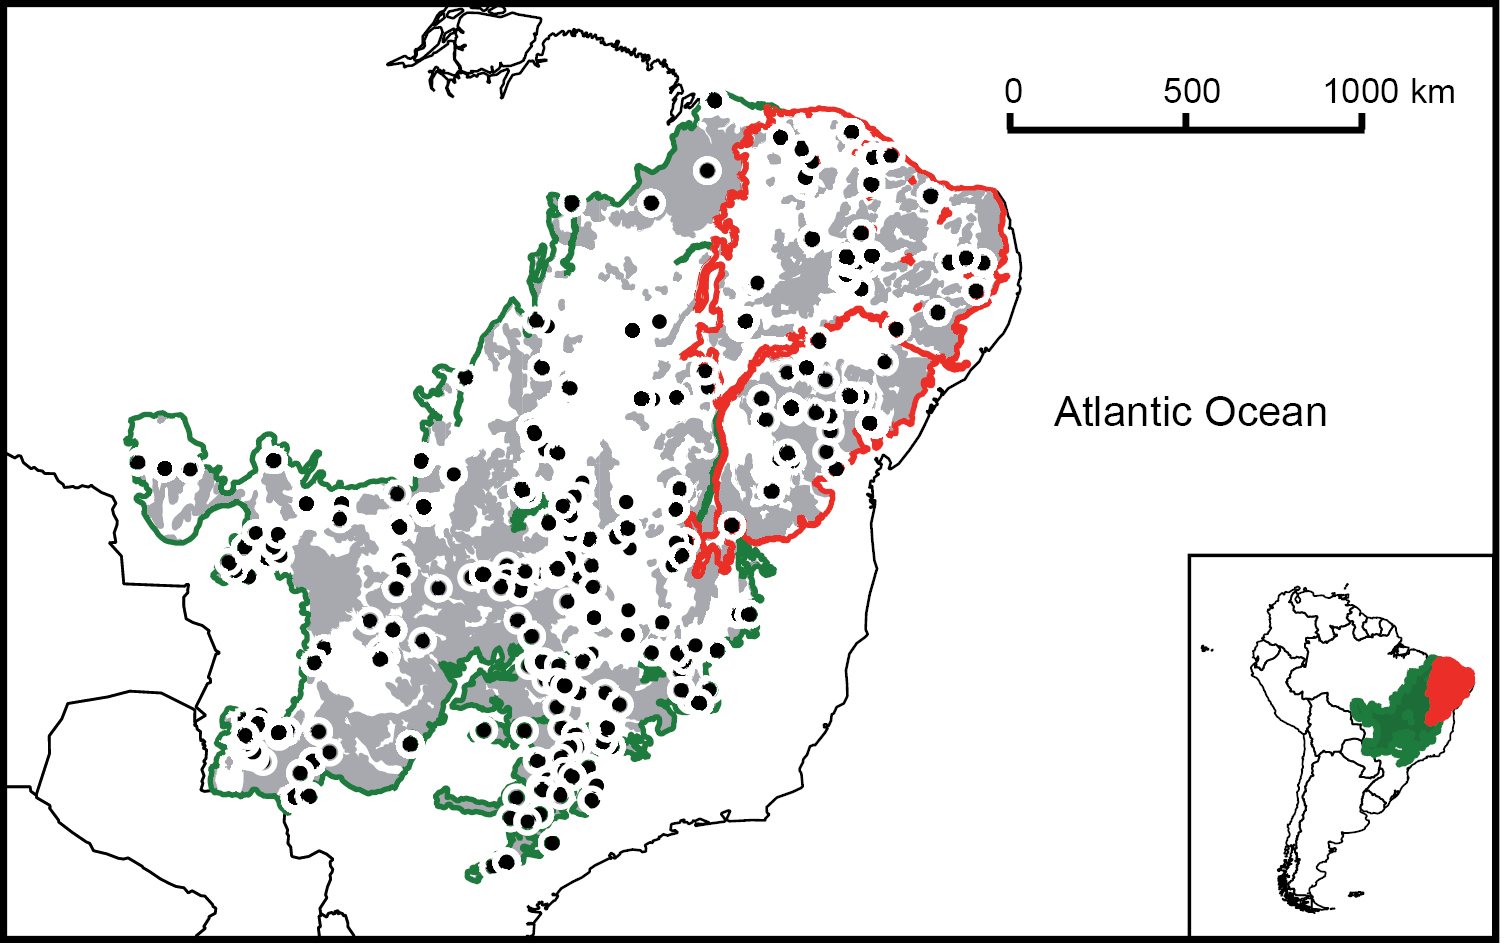
Sampling conducted for mammals and habitat lost due to human activities in the Caatinga and the Cerrado. Dots represent sites where sampling has been conducted according to data from the Global Information Biodiversity Facility (GBIF) and Ribeiro et al. (2010). These data represent a highly conservative proxy of the sampling conducted in these biomes (see Discussion). Areas in grey represent areas where habitat loss has occurred due to human activities. Borders of the Caatinga (red) and the Cerrado (green) are restricted to Brazil (i.e., does not include the small portions of the Cerrado in Bolivia and Paraguay). The plotted data for habitat loss and biome borders were obtained from the Instituto Brasileiro de Geografia e Estatística. |